
Environmental research, maps and data for tropical Australia
Recent articles
-
Published on26 May 2022
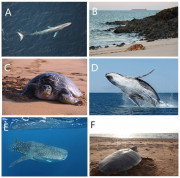 We used data from satellite telemetry tags attached to six species of threatened and migratory marine megafauna across three taxonomic groups (marine turtles, whales and sharks) off the coast of north-western Australia to map their areas of use. We then compiled spatial data from a range of threats and overlayed species and threat maps to assess the level of exposure of the species to threats. In doing so we can identify areas where there is high exposure of species to threats, where risk assessments can be best directed with resulting management actions if needed in order to protect these species.
 -
Published on26 May 2022
 We use genetics to estimate how far and wide oyster larvae can disperse to assist in setting biologically relevant spatial boundaries and harvest limits for oysters.
 -
Published on26 May 2022
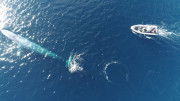 To assist in recovery of the population, spatial areas of importance to pygmy blue whales, known as Biologically Important Areas (BIA), have been identified by the Australian Government. The AIMS team and collaborators Centre for Whale Research and Curtin University set out to reduce uncertainty in identifying where important foraging areas for this species and their migration pathways and distribution exist, and the extent to which they overlap with anthropogenic activities by deploying satellite tags.
 -
Published on26 May 2022
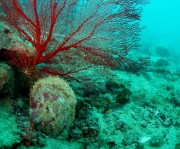
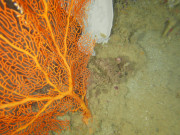 Key Ecological Features (KEFs) are parts of the marine ecosystem considered to be of particular importance for either a region's biodiversity or its ecosystem function and integrity. 13 KEFs have been defined for Australia’s North-west Marine Region, including the ‘Ancient Coastline at 125m depth contour’ (AC125). The AC125 is thought to “provide areas of hard substrate and therefore may provide sites for higher diversity and enhanced species richness relative to surrounding areas of predominantly soft sediment.” Little is known about what habitats exist on the sea floor in the AC125. Part of the reason is that the AC125 is very deep, and thus difficult to observe. The North West Shoals to Shore Research Program took underwater photographs and video of the seafloor to better understand each AC125 Area within its local context.
 -
Published on23 April 2021
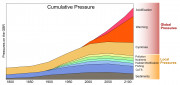 This site provides an introduction to cumulative impacts on coral reefs and outlines some of the latest research into understanding the interactive effects of these impacts and which affect different coral types the most.
Recent datasets
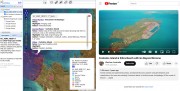
This dataset compiles georeferenced media - including videos (480), articles (20), and datasets (6) - specifically curated to facilitate the understanding of reef habitats across northern Australia. It was designed as a research tool for virtual fieldwork with a particular focus on identifying sources of information that allow an understanding of both inshore and offshore reef environments. This dataset provides a record of the literature and media that was reviewed as part of mapping the reef boundaries from remote sensing as part of project NESP MaC 3.17.
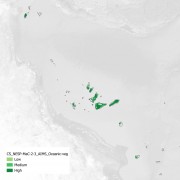
This dataset is a vector shapefile mapping the deep vegetation on the bottom of the coral atoll lagoons in the Coral Sea within the Australian EEZ. This mapped vegetation predominantly corresponds to erect macroalgae, erect calcifying algae and filamentous algae, with an average algae benthic cover of approximately 30 - 40%. Marine vegetation on shallow reef areas were excluded due to the difficulty in distinguishing algae from coral. This dataset instead focuses on the vegetation growing on the soft sediments between the reefs in the lagoons.
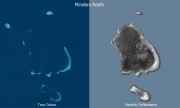
This code repository and dataset details a method for determining benthic reflectance from a combination of satellite imagery and bathymetry. Its key benefit is that it can map benthic reflectance up to 50 - 60 m in depth in clear waters, when using Sentinel 2 B2 channel combined with matching bathymetry data. Benthic reflectance is a measure of how much light the seafloor reflects and is useful for distinguishing areas that are sand (high reflectance) or vegetation such as seagrass, algae and coral (low reflectance).
This record provides an overview of the NESP Marine and Coastal Hub study - Developing an Integrated Pest Management Framework for Feral Pigs in Coastal Environments. For specific data outputs from this project, please see child records associated with this metadata.
This record provides an overview of the NESP Marine and Coastal Hub study - Assessing dugong distribution and abundance in the southern Gulf of Carpentaria. For specific data outputs from this project, please see child records associated with this metadata.