

Impacts of a severe tropical cyclone on inshore and offshore coral reefs
Tropical storms (cyclones, hurricanes or typhoons) are the most severe form of mechanical disturbance of coral reefs. In 2005, the severe Tropical Cyclone Ingrid crossed the Far Northern Great Barrier Reef. This storm provided a unique opportunity to improve understanding of the extent and type of damage inflicted on inshore and offshore coral reefs along a gradient of wind speeds. Surveys of 82 sites on 32 reefs along the wind gradient showed that the types and intensity of disturbance were well explained by local maximum wind speed, and by spatial and biotic factors. While offshore reefs had the deepest depth of damage, inshore reefs had the greatest rates of coral breakage and dislodgement. On a severely affected inshore reef, hard coral cover decreased about 8-fold, taxonomic richness decreased 2.5-fold, the density of coral recruits decreased by 30%, while massive coral cover remained unaltered. Maximum winds <28 cm s-1 for <12 hours inflicted only minor damage on any reef, but winds >33 m s-1 and >40 m s-1 caused catastrophic damage on inshore and offshore reefs, respectively. Observations from this cyclone were used to predict potential changes in storm-related coral loss at a scenario of altered cyclone intensity.
Background
This contribution is based on the study: Fabricius KE, De’ath G, Poutinen ML, Done T, Cooper TF, Burgess SC (2008) Disturbance gradients on inshore and offshore coral reefs caused by a severe tropical cyclone. Limnology and Oceanography 53: 690–704 www.aslo.org/lo/toc/vol_53/issue_2/0690.pdf (10 MB).
Severe tropical storms, known as tropical cyclones (TC) in the southern hemisphere, typhoons in the northwest Pacific, and hurricanes in North America, frequently occur betwen 10 to 30 degrees latitude north and south. They cause significant perturbations in marine ecosystems including coral reefs (Harmelin-Vivien 1994, Done 1992; Gardner et al. 2005). Not only coral cover, but also the abundances of fish and other coral associated organisms that depend on structurally complex habitat may decline when reef structures are flattened.
There is a significant level of variability in the type and intensity of storm effects, and several studies have aimed at identifying the best predictors for storm damage (e.g., Done 1992; Gardner et al. 2005; Puotinen 2007). The ecological effects of storms on coral reefs can have legacies of years to centuries (Connell 1997), so is important to further improve understanding of the factors that determine differences in storm effects between reef locations and among coral community types.
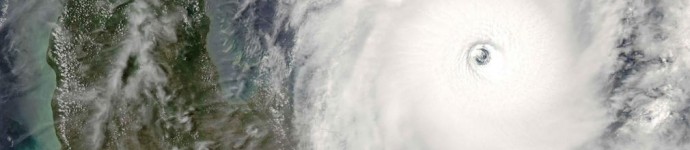
Severe Tropical Cyclone Ingrid crossed the Great Barrier Reef (GBR) in March 2005. TC Ingrid was a category 4 cyclone with a central atmospheric pressure minimum of 925 hPa. Its core was clearly defined and only 10 – 15 km in diameter, crossing the continental shelf in a straight line over offshore and inshore reefs (Fig. 1). Preliminary estimates from the Australian Bureau of Meteorology suggested that wind gusts within the destructive core reached speeds of at least 70 m s-1 (250 km h-1). In the core, wave heights of 15 m were estimated for the open ocean, and >5 m within the GBR lagoon. TC Ingrid crossed the continental shelf of Far Northern Queensland at 13.2 degrees latitude S (Fig. 1), a section of the reef that had experienced a regime of low disturbance for several decades. Due to its strength and clearly defined core, TC Ingrid was a near-perfect storm for investigating how the intensity and types of storm disturbance change on inshore and offshore reefs along a gradient of increasing wind speeds, and to identify the role of other factors in determining the extent of damage.
The data gained from reef surveys after TC Ingrid also provided a basis for considering the effects of potentially increasing frequency and intensity of cyclones with increasing sea surface temperatures on different types of coral reefs. Several studies have shown that the proportion of intense tropical storms reaching categories 4 and 5 has increased significantly within the last 35 years in many geographic regions (Walsh et al. 2004; Webster et al. 2005; Klotzbach 2006, but also see Kossin et al. 2007). When assessing the relationship between storm intensity and a range of environmental variables, the increase in the frequency of category 4 and 5 hurricanes between 1970–2004 was best explained by increasing sea surface temperatures, while other environmental variables contributed substantially less to the observed global trend (Hoyos et al. 2006). The ecological implications of intensifying storms could be severe, as the energy dissipated by a storm above water increases as the cube of a storm’s maximum wind speed, with the diameter and transition time of the storm additionally contributing to its likely damage (Emanuel 2005).
Methods
Details of the methods are found in Fabricius et al (2008). Field work was conducted in the far northern region of the GBR (latitude 12º – 14º S) 6 – 7 weeks after the cyclone crossed. The sparse existing data suggest a regime of little perturbation within the previous 30 years, and coral cover may have averaged ~40% on reefs within this region before TC Ingrid crossed (Devantier et al. 2006, and own unpublished data showing 42 – 58% coral cover recorded by video prior to the cyclone; see below, and our records of 38 – 70% remaining coral cover in our large-scale cyclone surveys on sites away from the cyclone path; see below).
For the large-scale surveys, 14 offshore and 18 inshore reefs up to 70 km away from the path were surveyed (Fig. 1). On each reef, a front and back reef aspect (site) and where possible a northward facing site were surveyed. Snorkelling observers on manta tow boards were towed by two inflatable dive tenders following the reef edge. Each site consisted of six two-minute tows (transects), with start and end points recorded by GPS. At the end of each tow, the estimated maximum depth of visible damage, remaining cover of hard corals, octocorals, macro-algae, and blue-green algae as a percentage of available hard substratum, and 7 types of damage to coral and reef framework were recorded (Table 1), following Van Woesik et al. (1991), Done (1992), and Van Woesik et al. (1995).
Disturbance categories were rated at a scale from 0 to 5 (including half-steps): 0 = 0%; 1 = up to 5%; 2 = 6 – 20%; 3 = 21 – to 50%; 4 = 51 – 80%; 5 = >80%. Estimates were standardised across observers by comparing ratings at several transects before the surveys commenced.
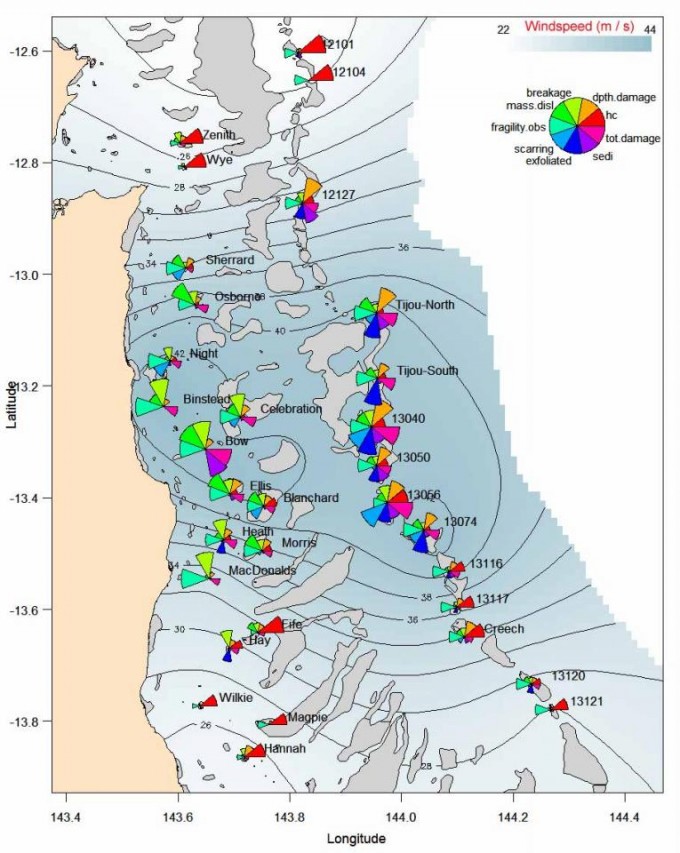
Table 1: List of survey categories used to assess cyclone damage, and their scales and definitions (Fig. 2):
- Benthic cover: Percent cover (% of available hard substratum) of hard corals (hc), macroalgae, and octocorals.
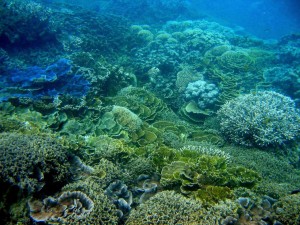
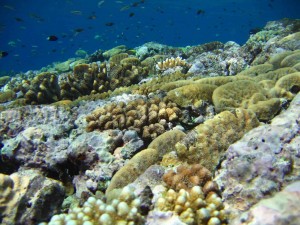
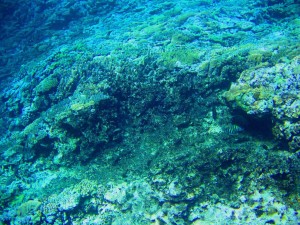
- Fragility: Fragility of the remaining reef framework, rated from 0 to 5: 0 and 1 = beds of extremely fragile branching and foliose corals and complex unconsolidated framework (e.g., Fig. 2A), 4 and 5 = flat consolidated substratum with little surface roughness and few breakable structure (e.g., Fig. 2D).
- Depth of damage: Maximum estimated depth (in meters) at which cyclone damage was visible.
Measures of disturbance (rated from 0 to 5; Fig. 2):
- Framework removed: Erosion and removal of the top layer of the reef framework.
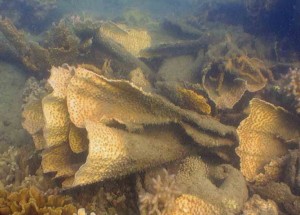
- Dislodgement of massive corals: Massive corals broken off at their bases, and often rolled onto their sides.
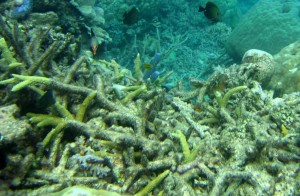
- Coral breakage: Remnants of corals with parts broken off, and loose coral fragments.
- Scarring by debris: Scars on living coral surfaces attributable to surge-borne debris.
- Octocorals torn: Torn gorgonian fans or bases of Sinularia colonies stripped off their tissues.
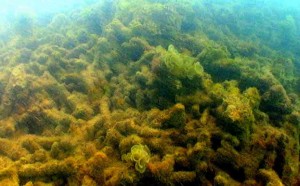
- Algal bloom: Blooms of algae (generally cyanophycea, filamentous diatoms or chlorophyta) covering extensive proportions of disturbed reef surface.
- Sediment transport: Sediment shifted down-slope or horizontally, often burying parts or whole coral colonies.
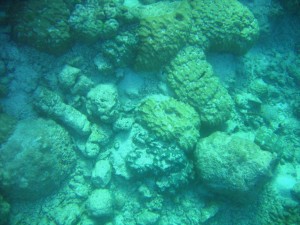
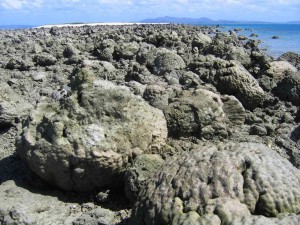
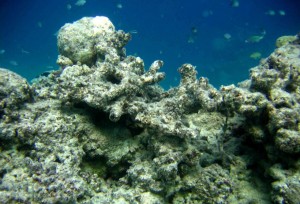
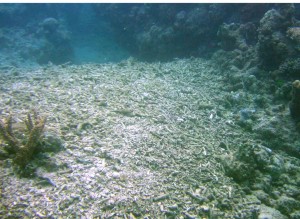
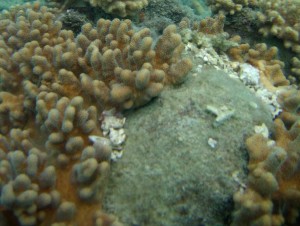
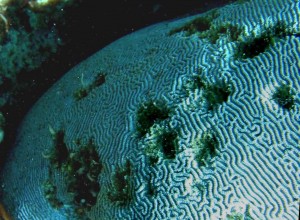
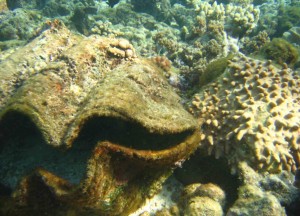
Figure 2: Reef features prior to disturbance by severe tropical cyclone Ingrid, and examples of disturbance by TC Ingrid on coral reefs of the Far Northern Great Barrier Reef.
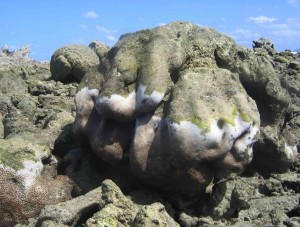
Dislodgement of massive corals. Some colonies were thrown onto a reef flat, complimenting others thrown up in earlier cyclones. Other heads up to 1.5 m in diameter came to rest on a terrace at 15 m depth, where their survival prospects are good.

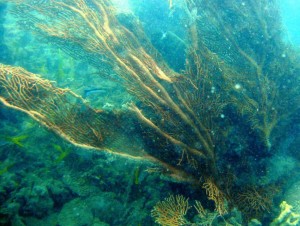
Tearing of octocorals. In Sinularia, a distinctive smooth base consisting of calcareous sclerites remains after the tissue is torn off.
Fine-scale surveys of benthic cover and taxonomic richness were conducted before and after the cyclone on four inshore reefs south of the path, namely MacDonald Reef (32 km distance to the path), Hay Island (46 km), Wilkie Island (54 km), and Hannah Island (67 km; Fig. 1).
- Video transects were recorded in February and October 2004 (i.e., 5 and 11 months before TC Ingrid), and in May 2005 (7 weeks after TC Ingrid) at both the windward and leeward side of the reefs (duplicate 25-m long transects run parallel to the depth contours at 3 and 8 m depth; 16 transects per reef and visit). Video tapes were processed using standard Australian Institute of Marine Science Long-Term Monitoring Program procedures (Abdo et al. 2003).
- Densities and taxonomic richness of hard coral and octocoral recruits (~0.5 to 5 cm in diameter) were assessed along the first 10 m of the same transects within a 0.3 m wide belt. Identification was in most cases to genus level, or to family level if the small size precluded distinguishing genera. Recruit densities had been determined with the same methods at these sites four years earlier (April 2001).
As a proxy for the potential wave energy, mean sustained wind speeds (10-min averages) and directions were modelled on a 1 km grid (McConochie et al.1999, Puotinen 2007). The model was run for all 490 transects every five minutes over 22 hours when the cyclone crossed the region, based on data on eye position, central pressure, and speed and direction of movement (provided by the Australian Bureau of Meteorology in 2006). Maximum hourly wind speeds were converted to categories of Australian cyclonic intensity, based on maximum 10-min sustained wind speeds (in m s-1; = knots / 1.945), and central pressure (note that a cyclone category 3 is roughly equivalent to category 1 in the Saffir-Simpson scale that is used for hurricanes and typhoons; Simpson and Riehl 1981):
- Category 1: ≥17 – 24.5 m s-1, 985-1000 hPa;
- Category 2: 24.6 – 32.5 m s-1, 970 – 985 hPa;
- Category 3: 32.6 – 44.2 m s-1, 945 – 970 hPa;
- Category 4: 44.2 – 55.3 m s-1, 920 – 945 hPa;
- Category 5: >55.3 m s-1, <920 hPa.
Results
Large-scale surveys
A broad range of disturbances was observed (Fig. 2). The worst affected inshore reefs were reduced to extensive rubble fields. On the worst affected outer-shelf reefs, more than half of the surfaces of crests and outer slopes were stripped off their framework down to solid substratum ~0.5 m below previous living coral surface (Fig. 2D). Coral breakage (Figs. 2C, E, F) and dislodgement of massive corals (Figs. 2G - I) were common events. Less commonly observed were torn or removed octocorals (Fig. 2L - M), probably because only few taxa leave visible skeletons behind. In many areas, strong currents had moved rubble and sand, accumulating in reef gutters and sometimes scarring or burying corals, and exposing previously buried reef (Fig. 2 J - K). In some cases, beds of rubble or fields of massive boulders came to rest on soft sediment on the leeward sides, effectively extending the area of colonisable hard substratum for reef growth by up to 10 m (Fig. 2H). Finally, there was significant recent mortality in clams (Tridacna spp., Fig. 2O).
TC Ingrid had a minimum central pressure of 925 hPa when approaching the GBR. On the outer shelf of the GBR, the eye of the cyclone progressed at ~10 km h-1 in west-north-westward direction. Reefs in the study region experienced sustained maximum winds ranging from 22 to 46 m s-1 (83 – 166 km h-1, equivalent to category 1 – 4). Towards the inshore it accelerated, progressing at 25 km h-1 before crossing the coast at 13.2°S. Gale-force winds lasted 7 to 20 hours offshore, and 7 to 15 hours inshore (Fig. 3A). Greatest wind speeds over the offshore reefs developed near the path, and over the inshore reefs ~10 km south of the path (Fig. 4B). Damage to the coral communities was greatest near the cyclone path on offshore reefs, and slightly south of the path on inshore reefs, coinciding with the distribution of maximum wind speed.
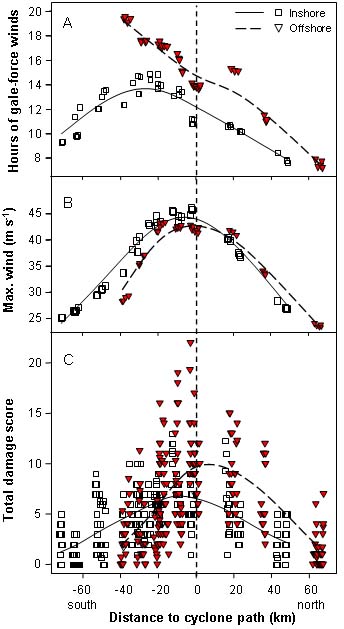
- The total damage score (sum of the 7 damage categories) was highest on some offshore sites between 0 and 20 km from the path. It doubled with each 10 m s-1 increase in maximum wind speed, rising more than four-fold as wind speed increased from 22 to 46 m s-1. Both offshore and inshore, it gradually attenuated with increasing distance from the path, to low scores 70 km to either side. Importantly, total damage varied greatly among equal-distant sites, hence numerous transects sustained only minor damage even on reefs directly within the path, evidence for the substantial patchiness typical of cyclone damage (Fig. 3C). Maximum 10-min averaged wind speed was the best predictor for reef damage. Variation in damage among the 82 sites was best explained by local wind speed, inshore and offshore position on the continental shelf, and reef aspect (front, back, and northern sites).
- Remaining hard coral cover decreased from lowest to highest maximum wind speed (22 to 46 m s-1), with a steeper decrease on the inshore reefs (mean: 40% to 8% coral cover) than on the offshore reefs (42% to 20%). Remaining coral cover was highest on the back reefs of offshore sites, probably due to the shelter provided by their reef flats. Remaining coral cover on the backs of inshore reefs was as low as on their front and northern sides, indicating that the small inshore reefs did not provide much shelter to their back sites.
- The depth of visible damage increased along the wind gradient to >15 m depth on offshore front and northern sites, 7 - 8 m on offshore back sites, and 7 - 8 m on all aspects of the inshore reefs.
- Coral breakage increased with maximum wind both inshore and offshore at all reef aspects. On average 5% of corals were broken on reefs at <22 cm s-1 winds, and >50% were broken at the reefs with strongest winds.
- Dislodgement of massive corals was low (<5%) at ≤35 m s-1, but steeply increased to 20 – 50% at strongest winds, with rates being higher inshore than offshore.
- Algal blooms and shifted sediments were infrequently observed, with the former occurring predominantly on offshore front sites at >40 m s-1 winds.
- Scarring was rarely observed at all but the most wind-exposed reefs (>40 m s-1).
- The removal of reef framework also occurred mostly at ≥40 m s 1 winds, and was greater on front and northern sites than on back sites.
Fine-scale ‘before and after’ surveys
The effects of the cyclone on reef communities varied greatly among the four inshore reefs, but were well explained by maximum wind speed, reef aspect and depth. In the year before the cyclone, hard coral cover averaged 42% to 58% on the four reefs. MacDonald Reef experienced above gale-force winds for 12.4 hours, with maximum winds of 33 m s-1. Cyclone damage was severe on this reef:
- Hard coral cover dropped 8-fold (from 55.1% ± 10.7 SE to 7.7% ± 4.5),
- the taxonomic richness in hard corals declined 2.5-fold (from 8.9 ± 1.6 to 3.6 ± 1.7 coral genera per video transect),
- the density of coral recruits was reduced by a third of initial densities (from 3.9 ± 1.4 to 2.6 ± 0.6 m-2).
In contrast, Hannah Island had above gale-force winds for 9 h, with maximum winds of 27 m s-1, and although it experienced some breakage, changes in coral cover, species richness and recruit densities were not significantly different from zero. Damage on Wilkie and Hay Islands was intermediate to that at MacDonald and Hannah, with losses of ~20% hard coral cover, while richness did not change significantly.
The fate of hard corals was strongly governed by their growth form:
- Branching and foliose corals severely declined with increasing winds, with greater losses shallow than deep, and on fronts than backs. At MacDonald Reef, some of the taxa with branching and foliose growth forms were reduced to 0 – 33% of their pre-storm cover (averaged over all aspects and depths). Prior to the storm, they contributed 84% to total hard coral cover (46% of 55%), but only 37% to generic hard coral richness. After the storm their contribution to total hard coral cover had dropped to 52% (4.8% of 9.2%), while their contribution to generic richness remained unchanged (40%).
- Corals with massive growth forms and unattached Fungiidae did not change in cover or richness in response to the wind at either depth or aspect. The genera Porites and Lobophyllia appeared to have increased by 22 and 12%, respectively, this was possibly through being more conspicuous after the canopy of branching corals had disappeared at MacDonald Reef.
Discussion
Tropical cyclone Ingrid was a nearly perfect storm to assess the type and extent of damage to coral reefs in relation to wind speed, since (1) this cyclone was strong yet small in diameter creating a clearly defined gradient in wind speeds, and (2) it crossed in a straight line through a region that had not been affected by major disturbances for several decades. About 84 reefs were located within the zone where maximum winds exceeded 33 m s-1 (3% of the ~2800 reefs of the GBR), and additionally 154 reefs (5.5% of GBR reefs) were within the zone of 28 – 33 m s-1. Minor damage was attributed to this cyclone as far as 160 km south of the path (T. Done, pers. obs.).
In open oceans, significant wave height is a function of both maximum wind speed and storm duration, and the square of wave height is proportional to wave energy (Kinsman 1965). However, wave height on the continental shelf is more difficult to predict due to the short fetch and shallow depth (Young and Hardy 1993). For TC Ingrid, maximum 10-min averaged wind speed was the best variable to explain the degree of reef damage in both the large-scale and small-scale data. Obviously, damage patterns vary substantially between different cyclones, due to their highly variable intensities, size, and movement characteristics. Nevertheless, our results complement those of Puotinen (2007) who showed that for three recent cyclones on the GBR, maximum wind speed was the best predictor of total damage in one, while storm duration was the best predictor in two other cyclones.
The severity of cyclone effects also varied between biota. For example, at MacDonald Reef hard coral cover decreased about 8-fold, taxonomic richness decreased 2.5-fold, the density of coral recruits decreased by 30%, while the cover of massive and unattached hard corals and octocorals did not change significantly. The relatively greater decline in hard coral cover than in richness was partly due to the fact that fragile corals, which had contributed >80% to coral cover prior to the cyclone, were set back in cover but not in richness. The severity of storm damage also differed between coral community types. Our data showed that the robust offshore communities suffered less breakage and dislodgement, and had greater remaining coral cover, than the inshore communities. The low rate of breakage on offshore communities is remarkable given that offshore communities had experienced three time greater wave heights than inshore communities (15 vs. 5 m significant wave heights near the track), which was also reflected in a two-fold deeper depth of damage (15 m offshore vs. 7 – 8 m inshore). This confirms that extreme waves are needed to inflict damage on robust coral communities, while much lesser forces can decimate fragile coral communities (Madin and Connolly 2006). Our finding of a more frequent dislodgement of massive corals on inshore reefs compared with offshore reefs is likely due to the fact that the fate of massive corals depends on the stability of and strength of attachment to the reef substratum, as they are being dislodged rather than broken by waves (Massel and Done 1993).
Thresholds for damage
Various forms of damage were only observed at winds above a certain threshold:
- Inshore, sites suffered catastrophic destruction at >33 m s-1 winds (category 3 or more) and storm duration of >12 hours. Here, over 80% of the branching and foliose corals were broken, a large proportion of massive corals dislodged, extensive swaths of framework removed, and remaining hard coral cover was <5%.
- On the robust offshore reefs, catastrophically denuded reef sites were only found where local winds exceeded 40 m s-1. At 33 – 40 m s-1 winds, variability in coral cover was high (10 – 50%), and breakage, framework removal, and dislodgement occurred at many, but not all, sites.
- Inshore and offshore reefs that had experienced <28 m s-1 winds (the lower end of category 2 or weaker) and storm duration of <12 hours showed only minor damage, with patchy breakage, the dislodgement of few massive corals, no framework removal, and ~40% remaining hard coral cover.
- Algal blooms, scarring, and shifted sediments were rarely recorded at <33 m s-1 winds.
Our results complement similar threshold estimates reported in previous studies. For example
- Done (1992) concluded from a large-scale study on the effects of TC Ivor on offshore reefs that cyclones with atmospheric pressure of 965 hPa or weaker (category 2 with winds of 25 – 33 m s-1) which cross in less than a day, would cause no serious damage at >50 km from the path to the left, and 30 km to the right, however patchy breakage, exfoliation, and dislodgement would be observed up to 200 km from the nominal cyclone path.
- Puotinen (2007) identified maximum winds of 24.7 m s-1 and storm duration of 19.5 h as thresholds above which wave damage to a reef was likely, however these two thresholds are unlikely to be independent: TC Ingrid caused serious damage at <15 h storm duration, most likely because maximum winds were high.
These studies in combination suggest that on relatively mature inshore and offshore reefs, severe damage occurs at wind and pressure conditions equivalent to TC category 2 or greater (>28 m s-1) if gale force winds last for more than 12 h. Even among the few severe cyclones, some cross the GBR so rapidly or with such convoluted paths that despite high wind speeds, wave heights and reef disturbance remain low. Others will cross recently disturbed sections where the few remaining corals are small hence relatively invulnerable. As a consequence, only about a third of the cyclones that pass the 2500 km long GBR (on average 1.6 yr-1 for the period 1969-2003) are capable of creating significant damage to coral reefs (Puotinen 2007).
The threshold in wind speed capable of causing severe loss in coral cover on undisturbed GBR sites (>28 m s-1) is approximately half that reported to cause coral loss in the Caribbean. Gardner et al. (2005) compiled data from >100 Caribbean sites where coral cover was recorded before and one year after a hurricane. They found that the loss in coral cover increased significantly with maximum hurricane intensity, from no discernible disturbance at wind speeds <51 m s-1 (100 knots) to a decline of up to 40% of cover at wind speeds approximating 80 m s-1. The greater vulnerability of reefs in the northern GBR compared to the Caribbean is likely due to the fact that Caribbean coral communities have been affected by a multitude of disturbances within the last 40 years, resulting in low coral cover, the removal of most fragile tall and branching corals, and simple framework structures (Gardner et al. 2003).
Storm damage is extremely patchy (Done 1992; Harmelin-Vivien 1994). The larvae dispersed from the many surviving corals will greatly aid coral recovery in the whole region. Furthermore, the rate of recovery of inshore reefs like MacDonald Reef will likely benefit from its remote setting with a low rate of terrestrial runoff of nutrients and sediments, and low exposure to fishing . Long-term monitoring is needed to quantify the recovery progress of these inshore and offshore reefs in the Far Northern GBR that are set in a regime of low natural and human-induced disturbance.
Potential implications of increasing storm intensities
The frequency of cyclones crossing the GBR is high. Between 1969 and 1997, 55 cyclones of category 1 or stronger (mean: 1.6 cyclones yr-1) have passed within 100 km of the GBR (Puotinen et al. 1997). The frequency of cyclones of categories 1 to 5 was 48%, 28%, 20%, 4%, and 0%, respectively (Puotinen et al. 1997). We used our large-scale survey data along the wind gradient to estimate loss in hard coral cover for each cyclone category, assuming a mean coral cover of 40% prior to the cyclone, and setting coral loss to 95% for category 5 cyclones for which no observations existed (Fig. 4). By multiplying cyclone frequencies with wind-related estimates of loss in coral cover, we estimated cumulative loss in coral cover in relation to the present-day cyclone frequency for relatively undisturbed inshore and offshore reefs (Fig. 4). This calculation shows that at present, most cyclone-driven losses in coral cover on the GBR are caused by category 2 and category 3 cyclones, because they are frequent and they kill a substantial proportion of corals. Losses caused by category 2 and category 3 cyclones are greater on inshore reefs than on offshore reefs. In contrast, losses in cover due to category 1 cyclones are less despite their relatively higher frequency, because they kill fewer corals per cyclone. Finally, losses in live coral cover due to cyclones in category 4 and 5 cyclones, while catastrophic, are rare and localized when considered over the scale of the whole GBR.
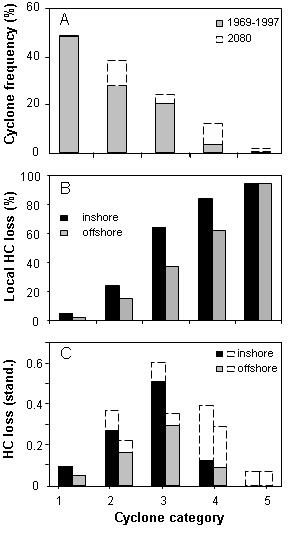
Since this study was conducted in 2005, three more category 4 – 5 cyclones hit the GBR (TC Monica, Larry and Hamish). Predictions about potential changes in the intensity of cyclones due to globally rising ocean temperatures vary (Webster et al.2005; Hoyos et al. 2006;Kossin et al. 2007). They range from ‘no change’ to as much as a 60% increase in potential destructiveness, the latter associated with an increase in mean annual tropical sea surface temperature of 0.25 °C (Sriver and Huber 2006). Others predict a gradual increase of 6 - 12% in maximum winds over the coming 80 years, equivalent to about half a cyclone category (Knutson and Tuleya 2004). On the GBR, a hypothetical increase in cyclone intensity by half a category would result in 50 – 60% greater cyclone-related loss in coral cover both inshore and offshore compared to present-day rates, assuming full recovery between events (Fig. 4). Probably most importantly, the proportion of fragile species, which are responsible for most of the structural complexity in reef communities, would decline far more rapidly than the proportion of massive species. With increasing disturbance intensity, the proportion of reefs in recovery state with low coral cover and low structural complexity would increase, with negative effects on abundances of coral-associated fish and invertebrates and their contributions in maintaining ecosystem functions.
Selected references
Abdo, D., S. Burgess, G. Coleman, and K. Osborne. 2003. Surveys of benthic reef communities using underwater video. Long-term monitoring of the Great Barrier Reef. Standard Operational Procedure No. 9. Australian Institute of Marine Science.
Connell, J. H. 1997. Disturbance and recovery of coral assemblages. Coral Reefs 16 (Suppl): 101-113. Devantier, L., G. De'ath, T. Done, E. Turak, and K. Fabricius. 2006. Species richness and community structure of reef-building corals on the nearshore Great Barrier Reef. Coral Reefs 25: 329-340.
Done, T. J. 1982. Patterns in the distribution of coral communities across the central Great Barrier Reef. Coral Reefs 1: 95-107.
Done, T. J. 1992. Effects of tropical cyclone waves on ecological and geomorphological structures on the Great Barrier Reef. Continental Shelf Research 12: 859-872.
Emanuel, K. 2005. Increasing destructiveness of tropical cyclones over the past 30 years. Nature 436: 686-688.
Fabricius, K., G. De'ath, L. McCook, E. Turak, and D. M. Williams. 2005. Changes in algal, coral and fish assemblages along water quality gradients on the inshore Great Barrier Reef. Mar. Pollut. Bull. 51: 384-398.
Gardner, T. A., I. M. Cote, J. A. Gill, A. Grant, and A. R. Watkinson. 2003. Long-Term Region-Wide Declines in Caribbean Corals. Science 301: 958-960.
Gardner, T. A., I. M. Côté, J. A. Gill, A. Grant, and A. R. Watkinson. 2005. Hurricanes and Caribbean coral reefs: impacts, recovery patterns, and role in long-term decline. Ecology 86: 174-184.
Harmelin-Vivien, M. 1994. The effects of storms and cyclones on coral reefs: a review. J. Coast. Res. 12: 211-231.
Holland, G. 1980. An analytic model of the wind and pressure profiles in hurricanes. Monthly Weather Review 108: 1212-1218.
Hoyos, C. D., P. A. Agudelo, P. J. Webster, and J. A. Curry. 2006. Deconvolution of the factors contributing to the increase in global hurricane intensity. Science 312: 94-97.
Hughes, T. P., and J. H. Connell. 1999. Multiple stressors on coral reefs: A long-term perspective. Limnol. Oceanogr. 44: 461-488.
Hutchings, P., M. Peyrot-Clausade, and A. Osnorno. 2005. Influence of land runoff on rates and agents of bioerosion of coral substrates. Mar. Poll. Bull. 51: 1-4.
Kinsman, B. 1965. Wind waves: their generation and propagation on the ocean surface. Prentice Hall.
Klotzbach, P. J. 2006. Trends in global tropical cyclone activity over the past twenty years (1986-2005). Geophysical Research Letters 33, L010805, doi:10.1029/2006GL025881.
Knutson, T., and R. Tuleya. 2004. Impact of CO2-induced warming on simulated hurricane intensity and precipitation: sensitivity to the choice of climate model and convective parameterization. Journal of Climate 17: 3477-3495.
Kossin, J. P., K. R. Knapp, D. J. Vimont, R. J. Murnane, and B. A. Harper. 2007. A globally consistent reanalysis of hurricane variability and trends. Geophysical Research Letters 34, L04815, doi:10.1029/2006GL028836.
Madin, J., and S. Connolly. 2006. Ecological consequences of major hydrodynamic disturbances on coral reefs. Nature 444: 477-480.
Massel, S. R., and T. J. Done. 1993. Effects of cyclone waves on massive coral assemblages on the Great Barrier Reef: Meteorology, hydrodynamics and demography. Coral Reefs 12: 153-166.
Mcconochie, J., L. Mason, and T. Hardy. 1999. A Coral Sea cyclone wind model intended for wave modelling, p. 413-418. Coasts and Ports '99: Challenges and directions for the new century. Proceedings of the 14th Australasian Coastal and Ocean Engineering Conference and the 7th Australasian Port and Harbour Conference.
Puotinen, M. L. 2007. Modelling the risk of cyclone wave damage to coral reefs using GIS: a case study of the Great Barrier Reef, 1969–2003. International Journal of Geographical Information Science 21: 97-120.
Puotinen, M. L., T. J. Done, and W. C. Skelly. 1997. An atlas of tropical cyclones in the Great Barrier Reef region: 1996-1997. CRC Reef Research Cent.
Rogers, C. S. 1993. Hurricanes and coral reefs: The intermediate disturbance hypothesis revisited. Coral Reefs 12: 127-137.
Scoffin, T. P., and F. G. Walton Smith. 1993. History of a fringing reef on the west coast of Barbados 1974-1992. Global aspects of coral reefs: Health, hazards and history. Rosenstiel School of Marine and Atmospheric Science, University of Miami.
Sriver, R., and M. Huber. 2006. Low frequency variability in globally integrated tropical cyclone power dissipation. Geophysical Research Letters 33, L11705, doi:10.1029/2006GL026167.
Sweatman, H., S. Burgess, A. Cheal, G. Coleman, S. Delean, M. Emslie, I. Miller, K. Osborne, A. Mcdonald, and T. A. 2005. Long-Term Monitoring of the Great Barrier Reef Status Report Number 7. Australian Institute of Marine Science.
Van Woesik, R., A. M. Ayling, and B. Mapstone. 1991. Impact of tropical cyclone "Ivor" on the Great Barrier Reef, Australia. J. Coast. Res. 7: 551-558.
Van Woesik, R., L. M. De Vantier, and J. S. Glazebrook. 1995. Effects of Cyclone 'Joy' on nearshore coral communities of the Great Barrier Reef. Marine Ecology Progress Series 128: 261-270.
Walsh, K. J. E., K.-C. Nguyen, and J. L. Mcgregor. 2004. Fine resolution regional climate model simulations of the impact of climate change on tropical cyclones near Australia. Climate Dynamics 22: 47-56.
Webster, P. J., G. J. Holland, J. A. Curry, and H.-R. Chang. 2005. Changes in tropical cyclone number, duration, and intensity in a warming environment. Science 309: 1844-1846.
Woodley, J. D., E. A. Chornesky, P. A. Clifford, J. B. C. Jackson, L. S. Kaufman, N. Knowlton, J. C. Lang, M. P. Pearson, J. W. Porter, M. C. Rooney, K. W. Rylaarsdam, V. J. Tunnicliffe, C. M. Wahle, J. L. Wulff, A. S. G. Curtis, M. D. Dallmeyer, B. P. Jupp, M. A. R. Koehl, J. Neigel, and E. M. Sides. 1981. Hurricane Allen's Impact on Jamaican Coral Reefs. Science 214: 749 - 755.
Young, I. R., and T. A. Hardy. 1993. Measurement and modelling of tropical cyclone waves in the Great Barrier Reef. Coral Reefs 12: 85-95.