

Water quality of the Great Barrier Reef: spatial and seasonal patterns

Water quality (WQ) is an important determinant of ecosystem health in the Great Barrier Reef (GBR). This articles summarise some of the main spatial patterns and seasonal changes in water quality. The information is based on two Reports, Death (2007), and De’ath and Fabricius (2008).
The main findings are:
(1) Space-time models are poor predictors of WQ parameters. Between 0% and 40% of the variation in WQ parameters is typically predictable, with chlorophyll and suspended solids being well predicted and dissolved forms of nitrogen being very poorly predicted.
(2) Concentrations of all WQ parameters decrease by 50–80% from the coast to a distance 15–20% across the reef. From there to the outer reef they typically decrease by an additional 0– 20%. The inner coastal strip should be the focus of future monitoring with fixed sites and automated logging of a few selected parameters; such as water clarity and chlorophyll. The cross-shelf declines vary along the coast, and are typically much steeper in the central third of the GBR and much flatter in the far north.
(3) Parameters of particulate WQ are highly correlated with each other, while parameters for dissolved WQ are less so. The parameters for particulates are only weakly correlated with those for dissolved WQ.
(4) Most WQ parameters vary between seasons. Nutrients typically peak in March-April and are 10–50% lower in August-September. This seasonal variation must be accounted for in sampling programs.
(5) Water clarity is highly predictable spatially (~75%) and predictability is very high compared to other WQ parameters. This statistical property, together with its known links to biotic function and ease of measurement, suggest water clarity could be a very useful indicator of WQ, but more work is needed to assess temporal variation.
The data sets
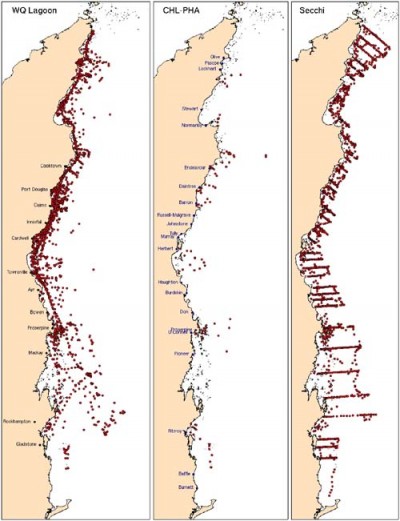
The three data sets investigated are lagoon water quality data comprising measures of 12 WQ parameters (1976-2006, AIMS), long-term chlorophyll monitoring data (1992-2006, AIMS and GBRMPA), and a composite data set on water clarity based on Secchi depth (DPIF and AIMS).
Lagoon water quality data comprising 12 measures of WQ, physical conditions and location were collected by AIMS (Miles Furnas and co-workers) from 1976-2006. Data on 12 WQ parameters collected over 30 years on the GBR lagoon were analysed for spatial and temporal patterns. The WQ parameters were chlorophyll (CHL), phaeophytin (PHA), nitrite (NO2), nitrate (NO3), ammonia (NH4), total dissolved nitrogen (TDN), particulate nitrogen (PN), dissolved inorganic phosphorous (DIP), total dissolved phosphorous (DOP), particulate phosphorous (PP), silicate (SI) and suspended solids (SS). For each one, between 10,221 and 19,327 samples were recorded at varying depths at 5561 sites (reduced to 4067). The resulting data showed high variance with many extreme high and low values, which is typical for WQ data (Figure 2).
Long-term chlorophyll and phaeophytin monitoring data were collected by GBRMPA and AIMS over the period 1992-2006. Data were sampled at 97 sites within 9 broad transects along the GBR (Figure 1). The transects were visited between 1992 and 2006 though in recent years some sites have been dropped and new ones added. These surveys have been reported elsewhere (Brodie et al, 2007). The analysis shown here differed from that of Brodie et al (2007) where trends were explored for separate regions.
A composite data set on water clarity based on Secchi depth. These data are mainly composed of DPI seagrass monitoring data (Rob Coles), but also include contributions from AIMS (Katharina Fabricius and Miles Furnas). These data comprised 2058 Secchi readings; 1371 from DPI seagrass surveys, 394 from the lagoon data and 293 from inshore surveys. The extensive and systematic coverage (Figure 1) makes them ideal to determine spatial patterns, taking into account spatial correlations between sites. The temporal data values were highly confounded with spatial locations, precluding investigations of the former. Addressing the issue of changes in water clarity over time should be a priority for future work.
The statistical data analysed are detailed in De’ath (2007) and De’ath and Fabricius (2008).
In brief, each variable was modelled spatially using generalised additive models (GAMs) and smoothing splines (Wood 2003). In all analyses the spatial predictors were relative distance across and along the reef rather than the usual latitude and longitude. This takes advantage of the natural boundaries of the GBR that affect many of its bio-physical processes, and thus one might expect that spatial distributions of observed data would be best explained (and best predicted) in this coordinate system. All analyses were done using the R statistical software system (R Development Core Team 2008).
Spatial patterns in water quality in the GBR
Among the coastal strips, Cape York had the cleanest water of all coastal regions for all variables. The coastal zone of the Burnett-Mary had the highest values of chlorophyll but relatively low levels of SS and PN. The coastal zone of the Burdekin had the highest values of SS, PN and PP, the second-highest chlorophyll value and the lowest Secchi depth value. The Wet Tropics had the second-highest values of SS, PN and PP.
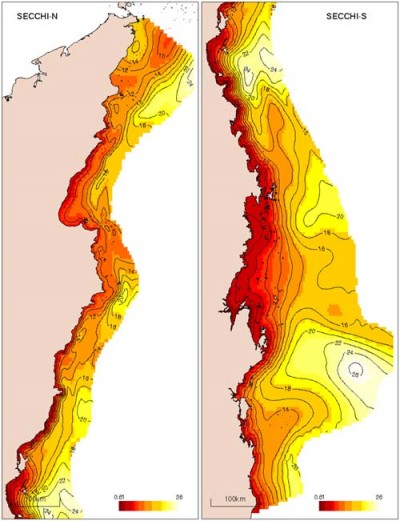
a) Secchi depth
Modeled mean Secchi depth averaged 12 m across the whole GBR with values ranging from <1 m to 26 m. Low values were encountered in the coastal strip between Port Douglas and Rockhampton (Fig. 2), with a mean Secchi depth of 3.7 m in the Burdekin region, and 4.4 m in the Mackay-Whitsundays region, compared to 10.2 m in the coastal zone of the Cape York region. In the inshore region, Secchi depth was lowest in the Mackay-Whitsundays (8.7 m), and highest in the Fitzroy (14.3 m). Changes across the continental shelf were steepest between Cairns and Mackay, and were weak north of Cape Flattery. Water clarity was greatest along the outer edge of the continental shelf and in the Swains where values averaged 13–16 m.
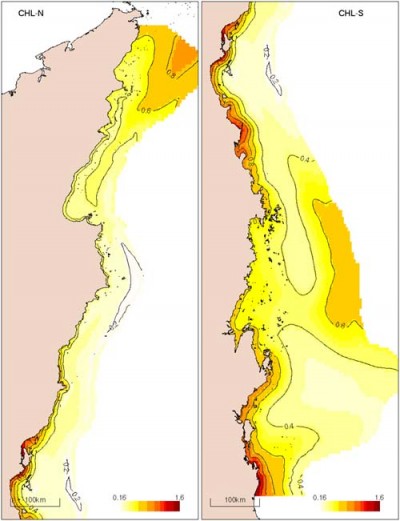
b) Chlorophyll
Modeled mean chlorophyll averaged 0.46 μg/L across the whole GBR, and ranged from 0.16 to 1.6 μg/L (Fig. 3). Chlorophyll increased from the north to the south in the coastal zone, but not in the offshore zone. Lowest values occurred in Cape York, followed by the Wet Tropics and Burdekin, with highest values in the southern Burnett-Mary. Offshore values varied little between regions and were independent of latitude (0.36 to 0.54 μg/L). Changes across the continental shelf were large in the southern and central parts of the GBR, but small in Cape York.
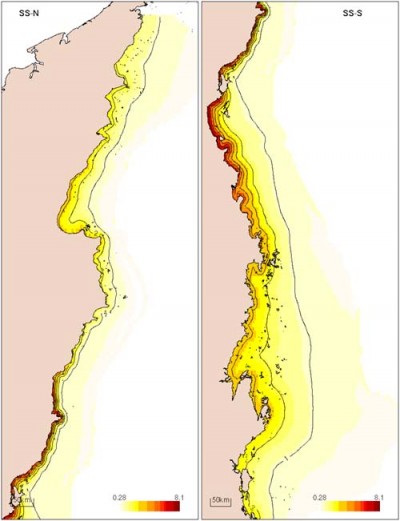
c) Suspended solids
Modeled mean SS averaged 2.1 mg/L across the whole GBR, ranging from 0.28 to >8 mg/L (Fig. 4). Values were highest and cross-shelf changes were most pronounced from the Burdekin to Port Douglas, with highest values between the Burdekin and Hinchinbrook Island. Offshore values were all low.
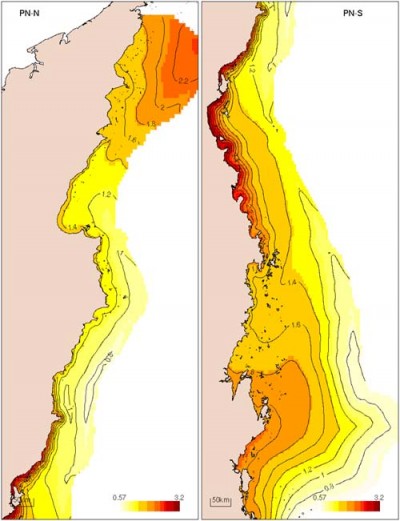
d) Particulate nitrogen
PN averaged 1.4 μmol/L (19.6 µg/L) across the whole GBR, ranging from 0.57 to 3.2 μmol/L (Fig. 5). Values were highest and cross-shelf changes were most pronounced between the Burdekin and Port Douglas. Coastal values were highest in the Burdekin region (2.6 μmol/L = 36.4 µg/L). Offshore values were lowest in the Burnett-May and highest in Cape York. Changes across the continental shelf were small in Cape York.
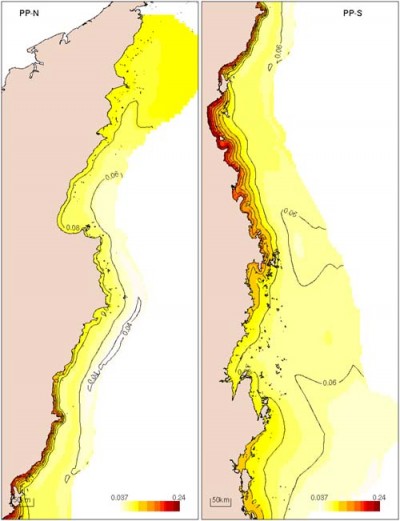
e) Particulate phosphorus
PP averaged 0.1 μmol/L (3.1 µg/L) across the whole GBR, with values ranging from 0.04 to 0.24 μmol/L (Fig. 6). Values were highest and cross-shelf changes most pronounced between the Whitsundays and Cairns, i.e. in the Burdekin and Wet Tropics region from south of the mouth of the Burdekin to Port Douglas. Offshore values were similar across all regions, averaging 0.06 μmol/L (1.86 µg/L). Changes across the continental shelf were large in the southern and central parts of the GBR but small in Cape York.
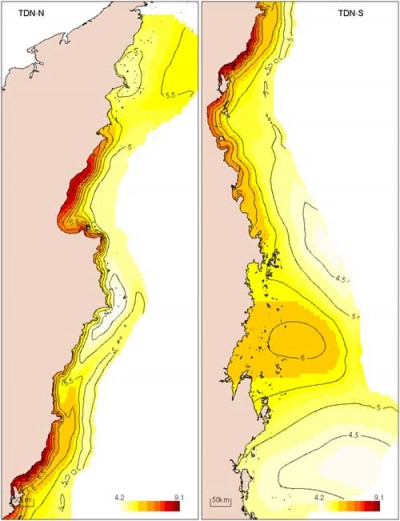
f) Total dissolved nitrogen
TDN averaged 5.3 μmol/L (78.4 µg/L) across the whole GBR, with values ranging from 4.2 to 9.1 μmol/L (Fig. 7). Values were highest and cross-shelf changes most pronounced in the Wet Tropics and the central part of Cape York. Values were extremely low around Cape Flattery, and were also low near Gladstone and the northern section of Cape York. Offshore values were similar across all regions, averaging 5.0 μmol/L (70 µg/L). Changes across the continental shelf were strong in the Wet Tropics and Burdekin, and small in the southern regions.
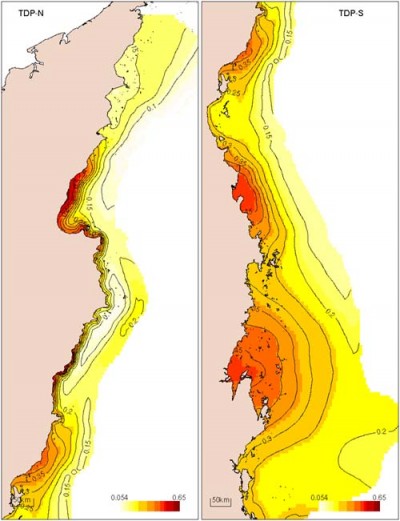
g) Total dissolved phosphorus
TDP averaged 0.23 μmol/L (7.1 µg/L) across the whole GBR, with values ranging from 0.05 to 0.65 μmol/L (Fig. 8). Values were highest and cross-shelf changes most pronounced in the Burdekin, the Mackay-Whitsundays, the Fitzroy and Wet Tropics Region. Values were extremely low around Cape Flattery, and were also low in the northern section of Cape York and near Gladstone. Offshore values doubled from the north to the south, and averaged 0.19 μmol/L (5.9 µg/L). Changes across the continental shelf were greatest in the Burdekin, Wet Tropics and Mackay regions.
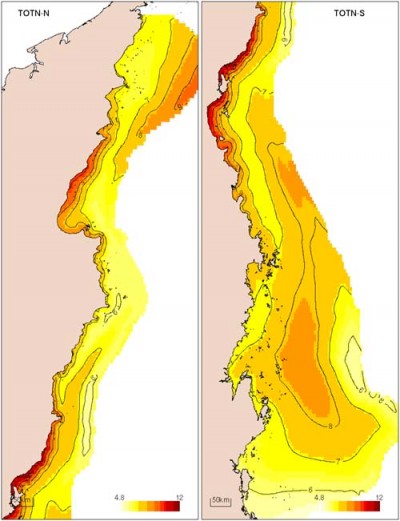
h) Total nitrogen
TN averaged 7.2 μmol/L (101 µg/L) across the whole GBR, with values ranging from 4.8 to 12 μmol/L (Fig. 9). Values were highest and cross-shelf changes most pronounced in the Wet Tropics and Burdekin regions. Values were extremely low around Cape Flattery, and were also low in the northern section of Cape York and near Gladstone. Offshore values were similar in all regions, averaging 7.0 μmol/L (98 µg/L). Changes across the continental shelf were great in the Burdekin, Wet Tropics and Mackay regions, and small in Cape York, Fitzroy and Burnett-Mary regions.
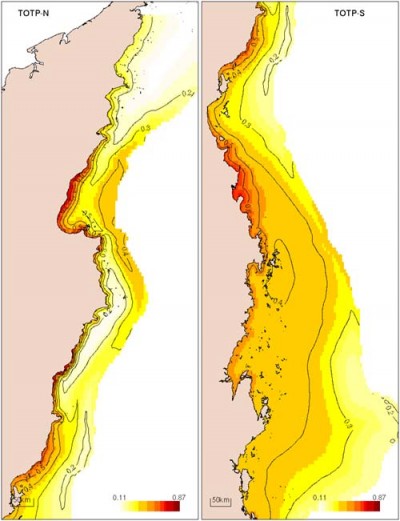
i) Total phosphorus
TP averaged 0.34 μmol/L (10.5 µg/L) across the whole GBR, with values ranging from 0.11 to 0.87 μmol/L (Fig. 10). Values were highest and cross-shelf changes most pronounced in the Burdekin, followed by the Wet Tropics and the Mackay-Whitsundays regions. Values were extremely low around Cape Flattery, and in the northern section of Cape York. Offshore values were similar in all regions, averaging 0.30 μmol/L (9.3 µg/L).
Seasonal patterns in water quality in the GBR
Changes in nutrients and chlorophyll were well predicted by season, regions and cross-shelf locations. Most values were consistently higher in summer than in winter apart from TDN and TN which were higher in winter than in summer. Seasonal differences were greatest in chlorophyll (summer to winter ratio: 2.2 across all regions), less in PP and PN (summer to winter ratio: 1.6 and 1.7, respectively) and weak in SS (summer to winter ratio: 1.2). Seasonal differences in chlorophyll and PP were consistent across the shelf and differed only weakly between the NRM regions. The most extreme seasonal differences were found in the coastal Fitzroy, where total chlorophyll and PN were >4 and 2.6 times higher in summer than in winter respectively, while SS and PP varied little between seasons in this region. Strong temporal variations were observed in some water quality variables.
Long-term chlorophyll and phaeophytin data
Spatial patterns are similar for chlorophyll and phaeopigments, which both decline across the shelf and increase from north to south. Averaged over the shelf, both chlorophyll and phaeopigments strongly decline across the shelf with a rapid decline in the inner 20% of the shelf followed by a flat period and then a further decline on the outer shelf. Similarly, both chlorophyll and phaeopigments increase linearly from north to south; chlorophyll increases by ~100% and phaeopigments by ~70%. Both chlorophyll and phaeopigments show cyclic variation across the year, with chlorophyll peaking in March and the phaeopigments cycle following about one month later. The cyclical variation is about 40% for chlorophyll and 30% for phaeopigments.
The structure of water quality data
Principal components analyses showed that CHL, PHA, PP, PN and SS (the solids) are strongly correlated, and the remaining 7 (dissolved) WQ parameters are less highly correlated but can still be grouped together. Thus, we can conclude that there is strong structure in the WQ data. It is dominated by a cluster of five WQ parameters (solids) and a weaker grouping (dissolved). The solids vary most strongly with relative distance across the reef.
References
Brodie, J, De'ath, G., Devlin, M., Furnas, M, and Wright M. (2007) Spatial and temporal patterns of near-surface chlorophyll a in the Great Barrier Reef lagoon. Marine and Freshwater Research 58:342-353.
Death G (2007) The Spatial, Temporal and Structural Composition of Water Quality of the Great Barrier Reef, and Indicators of Water Quality and Mapping Risk. Report to the Australian Government’s Marine and Tropical Sciences Research Facility. 59 pp.
De’ath G and Fabricius KE (2008) Water quality of the Great Barrier Reef: distributions, effects on reef biota and trigger values for conservation of ecosystem health. Final Report to the Great Barrier Reef Marine Park Authority. Australian Institute of Marine Science, Townsville. 100 pp.
R_Development_Core_Team. 2008. R: A language and environment for statistical computing. R Foundation for Statistical Computing, Vienna, Austria. ISBN 3-900051-07-0, URL https://www.r-project.org.