
Shipping in Queensland Map (Poster)
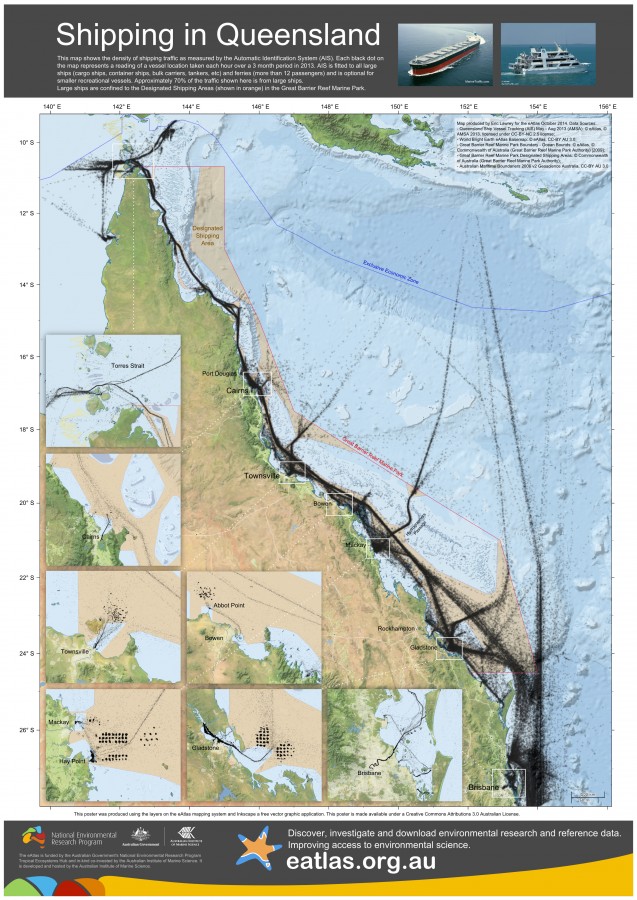
This map shows the density of shipping traffic as measured by the Automatic Identification System (AIS). Each black dot on the map represents a reading of a vessel location taken each hour over a 3 month period in 2013. AIS is fitted to all large ships (cargo ships, container ships, bulk carriers, tankers, etc) and ferries (more than 12 passengers) and is optional for smaller recreational vessels. Approximately 70% of the traffic shown here is from large ships. Large ships are confined to the Designated Shipping Areas (shown in orange) in the Great Barrier Reef Marine Park.
This poster highlights the traffic moving in and out of some of the majors ports along the coast including Brisbane, Gladstone, Hay Point and Mackay, Bowen and Abbot Point, Townsville, Cairns and the passage of ships through Torres Strait. In many of these points it can be seen that large vessels have to wait in a grid pattern before getting access to the port. This results in a grid of dark patches off the coast from the port.
You can view this poster as an interactive map.
This poster was developed for the NERP TE Conference in November 2014 by the eAtlas project. This poster was intended to be printed at A0 size. This poster is made available under a Creative Commons Attribution 3.0 Australian License.
This map was produced from the following data Sources:
- Queensland Ship Vessel Tracking (AIS) May - Aug 2013 (AMSA): © eAtlas, ©AMSA 2013, licensed under CC-BY-NC 2.5 license;
- World Bright Earth eAtlas Basemap: © eAtlas, CC-BY AU 3.0;
- Great Barrier Reef Marine Park Boundary - Ocean Bounds: © eAtlas, © Commonwealth of Australia (Great Barrier Reef Marine Park Authority) [2009];
- Great Barrier Reef Marine Park Designated Shipping Areas: © Commonwealth of Australia (Great Barrier Reef Marine Park Authority);
- Australian Maritime Boundariers 2006 v2 Geoscience Australia, CC-BY AU 3.0