
NESP TWQ Round 4 - Project 4.2 - Oceanographic drivers of bleaching in the GBR: from observations to prediction
This project produced a summary of the major publicly available temperature observations from physical oceanographic data collected on the Great Barrier Reef during the recent 2016 and 2017 mass coral bleaching events. The article 'Drivers of Bleaching on the Great Barrier Reef - Compilation of temperature data from 2015, 2016 and 2017' presents a compilation and analysis, summary plots of the data that can be interrogated and daily climatologies, as well as links to source data from multiple observing platforms.
This project aimed to understand how local, regional and global oceanographic and meteorological processes influence the severity and spatial variability of thermally driven coral bleaching for the Great Barrier Reef (GBR) and Torres Strait.
All available relevant environmental observations of the recent bleaching events were gathered to be more easily discoverable to researchers and managers via the compilation article (see link above).
The data assessed how well the eReefs models are modelling the recent warming during bleaching events and analysed the reasons behind the variations of bleaching response. 3D versions of remotely sensed bleaching products by NOAA and BoM were produced and a seasonal prediction capability for marine heatwaves was developed.
This project developed near realtime 3D Degree Heating Weeks data products that were integrated into the CSIRO eReefs model runs.
A workshop at the ACRS 2019 conference was run on accessing oceanic data for coral reef research. The manuals used in the workshop are now available.

All the reports, fact sheets and journal articles developed by this project are available from the Project 4.2 NESP Tropical webpage.
Images
Datasets
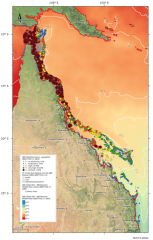
This dataset is a compilation of available ocean temperature data, aerial and in-water bleaching observations during the 2016 and 2017 bleaching events on the Great Barrier Reef in order to estimate the total reef area impacted by coral bleaching and thermal heat stress. A total of 982 reefs (56.8% reef area of the GBR) were surveyed in 2016 and 781 reefs (50.9% reef area of the GBR) surveyed in 2017.
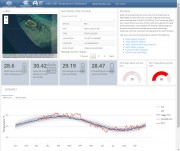
The dashboard set comprises individual web pages for each sensor/location. Each dashboard includes a map showing the location of the station, basic statistics and time series plots. If enough data is available (more than 10 years), a climatology of the temperature record is calculated. The SSTAARS climatology is also plotted along the sensor data. Hourly time series plots are also available at each instrument’s depth.
See "Interactive map of this dataset" resource link below for a navigation map to the dashboard web pages.
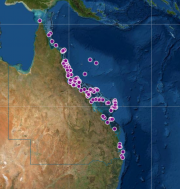
This collection of temperature logger data has been produced to cover the most recent back to back bleaching events in the Great Barrier Reef to be used as a reference data set for coral bleaching studies. The data comes from over 90 permanent temperature logger locations within the reef from the AIMS temperature logger program, 12 AIMS automatic weather stations, 6 AIMS-IMOS mooring sites and 15 Queensland Environment wave-buoys temperature loggers. The data were restricted from late 2015 to mid-2017.
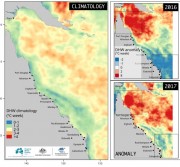
This dataset explores a new approach to predict coral bleaching events. It uses a temperature anomaly map to create a spatially dynamic temperature threshold for the calculation of degree heating weeks (DHW) instead of using a static constant. The dynamic threshold was used to classifies map areas with low, medium or high risk of coral bleaching for years 2016 and 2017.
Methods:
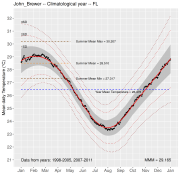
The climatology of the GBR temperature loggers is based on the hourly registers from loggers with 10 or more years of data, up to 2012 and for "Slope" and "Flat" locations on the reef.
The climatology is important as a reference point for comparison of future values. It also allows to compute the anomalies which represent the deviations from an established baseline. The data comes from the AIMS temperature loggers program and contains temperature registers as old as from 1991, providing for some sites, a time series of water temperature for more that 28 years.