
Marine Monitoring Program - Inshore water quality monitoring (AIMS)
This page is archived and only represents the MMP up to 2020. The new main web page for all of the MMP is managed by GBRMPA.
Water quality is an important factor affecting the health of coral reefs and seagrass meadows of the Great Barrier Reef (GBR) lagoon. Long-term water quality monitoring (part of the Reef 2050 Water Quality Improvement Plan) is fundamental to determine the status and trends of coastal water quality of the GBR, and has been ongoing since 2005.
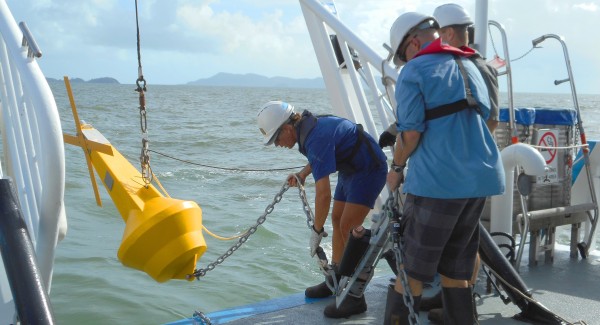
Figure 1. AIMS scientists deploy a mooring at the mouth of the Tully River. Instruments on these moorings measure temperature, salinity, turbidity, and chlorophyll continuously throughout the year.
Management of water quality through Reef Plan is undertaken along the catchment-to-reef continuum. Land management actions are designed to reduce the runoff of nutrients and sediments into the marine environment through changes to agricultural and industry practices. It is important to note that improvements in coastal water quality may take years to become detectable despite ongoing land management actions. This is due to the complex nature of the GBR lagoon, which has natural sources of variability such as large differences in annual rainfall. Ongoing and consistent monitoring is therefore crucial to be able to differentiate between long-term effects of changes in land use and natural environmental variability.
Monitoring
Water quality monitoring occurs at inshore sites in four Natural Resource Management Regions (NRM) regions: the Cape York, Wet Tropics, Burdekin, and Mackay Whitsunday regions. Some of these sites have been monitored since 1989 and represent the longest available time-series of water quality data in the GBR.
Figure 2. Locations of inshore water quality monitoring sites of the MMP. This map is downloadable as a KMZ. This layer shows two main datasets:
- Routine water sampling sites (nutrients, total suspended solids, chlorophyll a, temperature, salinity, Secchi depth), which are monitored 5-10 times per year depending on the focus region, from 2005-present
- Event water sampling sites (same measurements as routine), which are monitored only during large flood events
- Logger sites (continuous records of turbidity and chlorophyll) from 2007-present
We collect water samples that are analysed for a comprehensive suite of dissolved and particulate nutrients, total suspended solids, chlorophyll a, temperature, salinity, and Secchi depth (a measure of water clarity). We also use data-logging sensors to continuously measure temperature, salinity, chlorophyll a, and turbidity on selected reefs and at three river mouths. Water samples are analysed in AIMS laboratories using state-of-the-art methods.
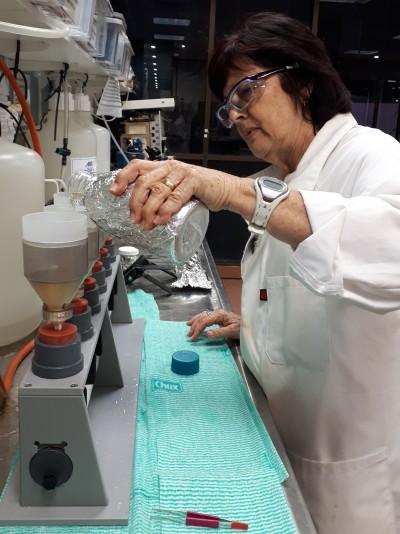
Figure 3. AIMS scientist Margaret Wright filtering seawater to measure concentrations of chlorophyll a.
Inshore monitoring data show decreased water clarity (higher turbidity and concentrations of suspended solids, with smaller Secchi depths) and increased levels of nutrients (higher concentrations of nitrogen, phosphorus, and chlorophyll a) at reef sites that are close to the coast and the mouths of rivers. Periods of high river flow result in flood plumes, which transport nutrients and sediments to the coastal zone and temporarily reduce water quality. Flood plume material is deposited near the mouths of rivers and additional nutrients are released over time by bacterial action.Inshore seafloor sediments are also cycled in and out of the water column through resuspension by waves; this mixing is a natural process that affects water clarity, but it may also enhance the movement of land-derived nutrients into the water column.
An example of the short-term variability of water quality is shown in Figure 4 using data collected by a deployed logger at Snapper North in the Wet Tropics NRM region. Note that turbidity and chlorophyll measured at this reef often exceed the GBR Water Quality Guidelines (shown as dashed horizontal lines). Guideline values help managers and scientists understand if water quality has the potential to have a detrimental effect on marine ecosystems. Turbidity and chlorophyll measurements exceeding these threshold values (such as during periods of high river discharge) may be negatively impacting reefs and seagrass meadows.
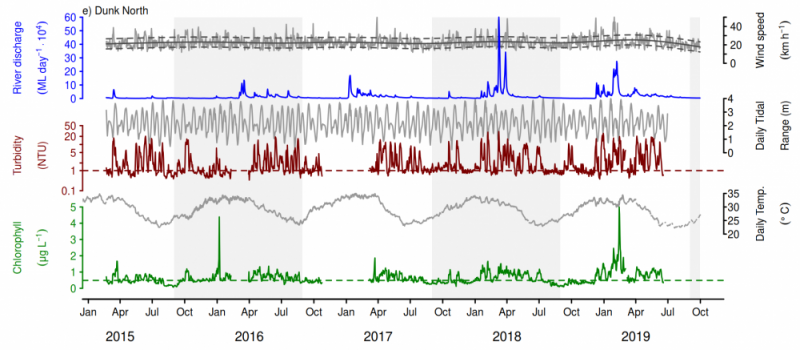
Figure 4.Time-series of turbidity (brown line) and chlorophyll concentrations (green line) measured by the Dunk North logger. Additional panels represent daily freshwater discharge from nearby rivers (blue line), wind speeds, tidal range, and daily temperature. Horizontal dashed lines show the GBR Water Quality Guidelines for turbidity and chlorophyll. The large peak in chlorophyll in Feb 2019 occurred following flood events in early Feb
Water Quality Index
Water quality is composed of multiple parameters (described in the section above) that change through time and can be highly variable within short periods (such as river floods). To provide an integrated assessment of how water quality is tracking relative to GBR Water Quality Guidelines and to show trends over time, AIMS developed the Water Quality Index. The Index is based on data collected in the MMP from 2005 onwards and is calculated annually. Scores are derived from five groups of key variables:
- Total suspended solids concentrations, Secchi depth, and turbidity;
- Chlorophyll a concentrations;
- Particulate nitrogen concentrations;
- Particulate phosphorus concentrations; and
- Dissolved inorganic nitrogen (NOx) concentrations in water samples.
Guideline values are site-specific, meaning that threshold values of the above variables differ with distance from the coast (enclosed coastal, open coastal, mid-shelf, and outer-shelf) and with region. This helps account for natural differences in water quality that occur with distance offshore and north-to-south along the GBR lagoon. Beginning in 2015, separate scores were calculated each year to represent the long-term and annual conditions in water quality. Long-term scores use statistical techniques to remove year-to-year variability (e.g., a “large” wet season), allowing us to see trends in water quality over many years. Annual condition scores show the condition for each year, and are sensitive to year-to-year variability. Scores are presented in a “traffic light” colour scheme consistent with other marine condition reporting under the Paddock to Reef Monitoring, Modelling and Reporting Program: red (very poor), orange (poor), yellow (moderate), light green (good), dark green (very good).
The site-specific monitoring has been important in identifying regional hotspots of reduced water quality. During the period from 2005 to 2019, the Water Quality Index has shown that conditions are declining in the Burdekin and Mackay Whitsunday regions, and have stabilised in the Wet Tropics region. Annual condition scores show that water quality for the 2018-19 year was considered “moderate” in all three regions.
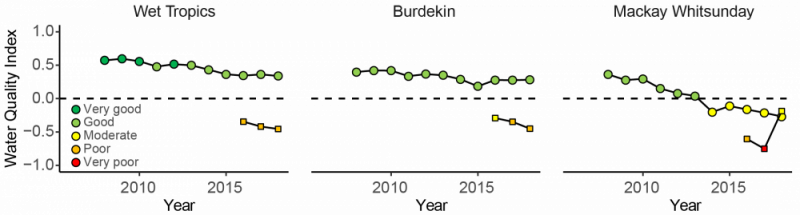
Figure 5.The Water Quality Index integrates multiple water quality parameters to show condition and trend of inshore water quality in each NRM region (relative to the GBR Water Quality Guidelines). Colours indicate condition. Circles represent the long-term trend in water quality (since 2005), which is not sensitive to year-to-year variability (e.g., a “large” wet season). Squares represent the annual condition in water quality, which is sensitive to year-to-year variability. For further details, see the Marine Monitoring Program: Annual report for inshore water quality monitoring 2017-18 available at http://hdl.handle.net/11017/3490
This page summarises one component of the MMP. Information about the whole program and links to other components can be found here.
Reports from this project
All annual technical reports on the MMP
Quality assurance documentation and manuals for the MMP
External independent reviews of the MMP
References
Gruber, R., Waterhouse, J., Logan, M., Petus, C., Howley, C., Lewis, S., Tracey, D., Langlois, L., Tonin, H., Skuza, M., Costello, P., Davidson, J., Gunn, K., Lefevre, C., Shanahan, M., Wright, M., Zagorskis, I., Kroon, F., Neilen, A., 2019, Marine Monitoring Program: Annual Report for Inshore Water Quality Monitoring 2017-18. Report for the Great Barrier Reef Marine Park Authority, Great Barrier Reef Marine Park Authority, Townsville. Available at: https://hdl.handle.net/11017/3490
| Attachment | Size |
|---|---|
| 8.34 KB |
Images
Datasets
This data collection was started in 2005 as part of the Reef Plan. \n \nNearshore water quality data from direct water sampling by Niskin cast (suspended solids; chlorophyll; nitrogen, phosphorus and organic carbon species; silicate), summarised for the whole Great Barrier Reef and for each Natural Resource Management (NRM) region, by year (2005/06, 2006/07, etc.) and season (dry season, May-Oct; and wet season, Nov-Apr). Salinity, secchi depth, and temprature. \n \nFrom October 2007 data loggers are deployed at 14 sites to record readings of chlorophyll a and turbidity every 10 minutes.