 eAtlas Data Catalogue
Alluvial and Hillslope Gully Mapping – Digital gully mapping based on lidar data collected 2018-2019 in sections of the Burdekin, Fitzroy, and Normanby catchments. (NESP TWQ 5.10, Griffith University)
This dataset contains maps of alluvial and hillslope gullies across four large blocks of lidar covering portions of the Burdekin, Fitzroy, and Normanby Catchments. The gully polygons were generated using methods developed in the NESP 5.10 project for the extraction of gullies from lidar. Lidar is detailed topographic data collected from aircraft using an airborne laser scanning system.
A significant component of the cause of declining water quality and the health of the GBR is increased land based erosion leading to sediment pollution within the rivers draining into the GBR lagoon. Gullies are a significant proportion of the erosional sediment sources within the GBR catchments.
Lidar is detailed topographic data collected from aircraft using an airborne laser scanning system. Airborne lidar data and orthophotography were acquired for the three study areas (portions of the Burdekin, Fitzroy, and Normanby Catchments) in 2018 and 2019 as part of a Department of Environment and Energy program to improve investment prioritisation in the management of erosion and fine sediment losses to the reef through the establishment of a new baseline of extent of gully and streambank erosion. CSIRO undertook and oversaw the program, contracting the aerial imaging and mapping company Aerometrex to acquire, process and provide the data.
The data provider supplied classified lidar point cloud data, orthophotography imagery, and Digital Elevation Models (DEM), with 0.5 m cell size, derived from point cloud data. To produce DEMs the points within the cloud must be classified into ground and non-ground points. CSIRO performed quality control analyses of the provided point cloud data and the ground/non-ground classification. The lidar acquisition achieved average point densities in the range of 20 to 30 ground points per square metre. The DEMs supplied by the data provider, via CSIRO, were used for this mapping dataset.
Griffith University developed methods and processes to map alluvial and hillslope gully polygons, estimates of potential active erosion within gullies, and estimates of total volume of sediment eroded over the lifetime of these gullies. The conceptual model of the gullies that are being mapped, stems from work undertaken through NESP Project 4.9, and prior to that the MTSRF Normanby Sediment Budget Project which followed on from projects undertaken through the TRaCK Program.
Methods:
The project that produced this dataset was an investigation into developing methods to extract gullies from digital topographic data and is almost entirely a processing method. A full description of the method is available in the NESP 5.10 report.
Below is a summary of the method. The data provider (Aerometrex) supplied classified lidar point cloud data, orthophotography imagery, and Digital Elevation Models (DEM), with 0.5 m raster cell size, derived from point cloud data. The DEMs were hydrologically conditioned making the modelled hydrology derived from the DEMs continuous and without disruptions. A mask of channels, roads, and dams was produced and these areas of the DEM removed from the analysis. The landscape setting was analysed and separated into rugged areas and flat to gently undulating areas, that is, hillslope and alluvial landscapes.
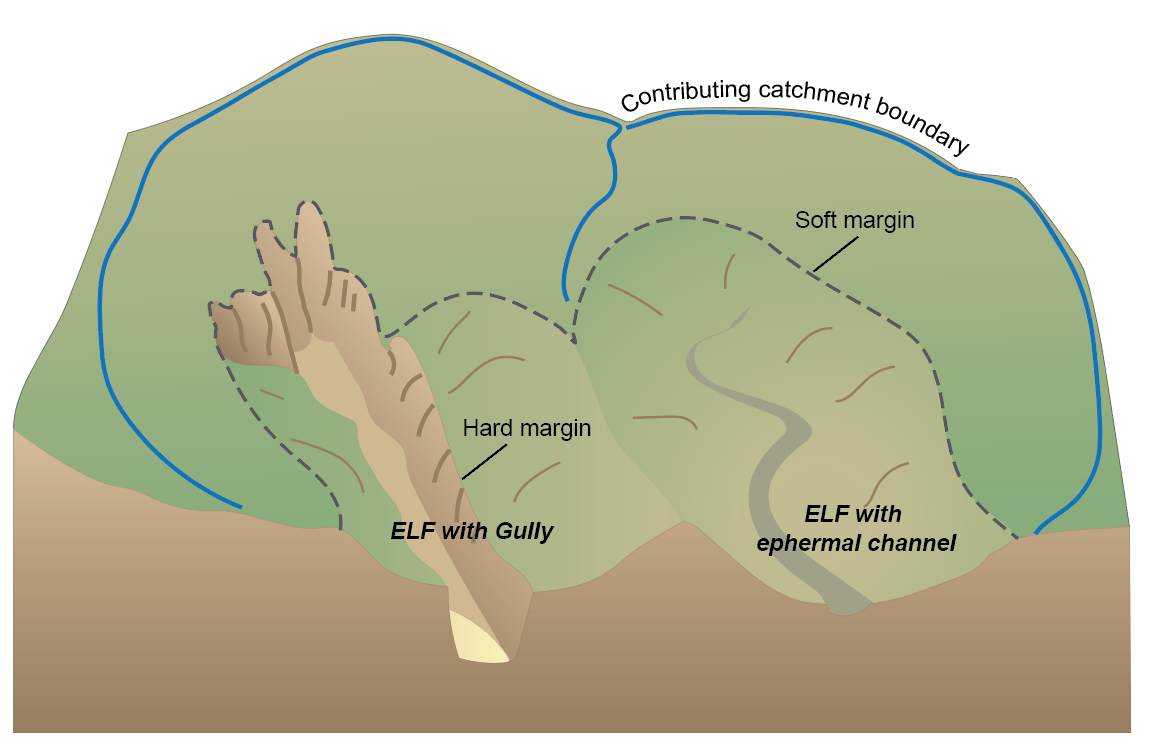
Landscapes, in certain configuration, exhibit a distinct break in slope that denotes a change of the predominant geomorphological processes acting on the landscape. A commonly observed break in slope in the landscape is the transition from hillslopes to alluvial floodplains. A break in slope can be observed where a mostly stable land surface changes to a predominantly eroding land surface. An example of this change is observed in large floodplains where the near horizontal surface of the floodplain is interrupted by a gully incising into the floodplain material. Another example is on hillslopes where the stable slopes are interrupted by a gully incising into the soil mantle. These breaks in slope (referred to as ‘soft margins’ of erosional landscape features) where mapped. Two different methods were used to map the soft margins in hillslope and alluvial landscapes.
The mapping of soft margins within the hillslope landscapes involved a method that performs a statistical smoothing of the elevation data within DEM to produce a smoothed land surface. The elevation of the smoothed land surface is subtracted from the original land surface. Within this subtracted layer the soft margins can be extracted.
The mapping of soft margins within the alluvial landscapes involved a combination of landscape concavity and multi-directional hillshade models. The topography stored in the DEM can be used to model the casting of shadows across the landscape when the sun is at a particular bearing and angle to the horizon. In most GIS software a model of the shadow casts by the sun is referred to as a hillshade. A procedure was followed were multiple hillshades were generated with the sun bearing and vertical angle varied so as turn the sun through 360 degrees. From these multiple hillshade layers the parts of the landscape bounded by a break in slope that denote some type of erosional landscape feature were identified.
The soft margins contain aggregations of erosional landscape features. The erosional landscape features within the soft margins are disaggregated using a surface hydrology model derive from the DEMs. This disaggregation produces a map of erosional landscape features that are individual hydrologic units.
Actively eroding gullies are a type of erosional landscape feature. The gullies are filtered from the erosional landscape features using a combination of; occurrence of bare soil (no vegetation) derive from satellite imagery; a measure of surface roughness derived from the DEM; and a measure of potential active erosion derive from the DEM. The filtering produces polygons identifying actively eroding gullies. Where the boundaries of these gully polygons overlie a distinct scarp edge in the DEM the mapped boundary is referred to as a ‘hard margin’.
Estimates of total volume of sediment eroded over the lifetime of these gullies and a range of metrics (include in shapefile attribute table) were calculated for the gullies identified with the application of these mapping procedures.
Limitations of the data:
Mapping methods, processes, and filtering can generate false negatives and false positives. Within the tens of thousands of polygons there is a small possibility that a polygon is not identifying a gully, but some other closely associated geomorphic erosional landscape feature. If using this dataset to examine and evaluated specific gullies for any sort of assessment, such as, sediment control measures or rehabilitation earth works the polygons require comparison to remotely sense imagery or data and on site ground validation. Covid restrictions during the project limited the amount of ground verification that could be undertaken.
Format:
This dataset consists of three shapefiles.
- BBB_Gullies_withMetrics_for_Upload_v3.shp
- Fitzroy_2019_Gullies_withMetrics_for_Upload_v3.shp
- Laura_2019_Gullies_withMetrics_for_Upload_v3.shp
These three shapefiles are gully polygons covering a block of the Burdekin, Fitzroy, and Normanby River catchments. The shapefile’s attribute tables contain a range of gully metrics.
Data Dictionary:
- FID: Feature ID from ArcGIS
- Id: ID used by ArcGIS for analysis
- ZONAL_ID: Unique value for extracting zonal statistics
- Area_m2: Area of the soft margin (m2)
- GullyID: Prefix for landscape class plus gully number
- GulNum: Unique number for each soft margin
- Hard_m2: Area of the hard margin (m2)
- Hard_pct: Area of hard margin as % of soft margin
- PAE_m2: Area of Potential Active Erosion margin (m2)
- PAE_pct: Area of Potential Active Erosion as % of soft margin
- VegeData: A note that data on vegetation follows
- Ht2m_plus: Area of vegetation >= 2m tall (m2)
- pct2mPlus: Area of vegetation >= 2m tall as % of soft margin
- Soft_Geom: A note that data on geometry of soft margins follows
- SoftLen_m: Length of soft margin as defined by minimum bounding rectangle (m)
- SoftWith_m: Width of soft margin as defined by minimum bounding rectangle (m)
- SftPerim_m: Perimeter of soft margin (m)
- Soft_L_W: Ratio of soft margin Length divided by Width
- S_Prm_Area: Ratio of soft margin Perimeter divided by Area
- Hard_Geom: A note that data on geometry of hard margins follows
- HardLen_m: Length of hard margin as defined by minimum bounding rectangle (m)
- HardWith_m: Width of hard margin as defined by minimum bounding rectangle (m)
- HrdPerim_m: Perimeter of hard margin (m)
- Hard_L_W: Ratio of hard margin Length divided by Width
- H_Prm_Area: Ratio of hard margin Perimeter divided by Area
- Ht_Range: A note that data on elevation range within soft margins follows
- Elev_Range: Maximum elevation minus minimum elevation within soft margin (m)
- HtRng_PAE: A note that data on elevation range within potentially active erosion follows
- PAE_Range: Maximum elevation minus minimum elevation within potentially active erosion (m)
- FlowDist: A note that data on length of maximum flow path within soft margins follows
- FlowDist_m: Maximum flow length minus minimum flow length within soft margin, using downstream operator (m)
- Slope_FL: A note that data on gully slope derived from flow length follows
- Slope_FLen: Gully Slope calc from (Ht Range div by Flow Length) div by Pi times 180
- Slope_GL: A note that data on gully slope derived from geometric length follows
- Slope_GLen: Slope using gully length from Minimum Bounding Geometry (Ht Range div by Length) div by Pi times 180
- Connected: A note that data on gully connection to channel system follows
- Conxt_Y_N: Yes or No for connected or disconnected
- Disconnect: A note that data on the distance of disconnection follows
- DisCnctDis: The distance each individual gully is disconnected from the channel system (m)
- ErasedDis: The distance each individual gully is disconnected from the channel system minus the distance the flow path passes through other gullies (m)
- Diff: Total disconnected distance minus erased distance. Is the distance of diffuse overland flow (m)
- GulVol: A note that data on the excavated volume of material as calculated by the reconstructed lids method follows
- GulVol_m3: Volume of eroded material (m3) Derived from Prior Land Surface estimate
- AveDepth: Average depth of eroded pixels from Prior Land Surface method
- MaxDepth: Max eroded depth of eroded pixels from Prior Land Surface method
- UpArea: A note that data on the area of catchment contributing to the gully outlet follows
- Catmnt_ha: Area of contributing catchment as defined by the maximum flow accumulation value (m2)
- Cat_Ratio: A note that data on the ratio of gully soft margin to contributing catchment follows
- CatmtRat: Ratio of gully soft margin divided by contributing catchment area
- ContrbArea: A note that data on whether the area of catchment contributing to the gully outlet is completely within the extent of the Lidar follows
- WthInLidr1: 1 = contributing area is within Lidar extent. 0 = contributing area runs off Lidar
- CircRatio: A note that data on the circularity ratio of gully soft margin follows
- CircRato: Circularity Ratio (4*Pi*Gully Area) divided by perimeter squared
- SA_Ratio: A note that data on the Berry 2002 method for surface/area ratio of gully soft margin follows.
- SAR_SUM: Sum of 3D surface area values
- SAR_Norm: Ratio of 3D surface area to 2D surface area
- FiltMethd: A note that data on the success or failure to pass filtering criteria for presence of hard margins of PAE within soft margin follows.
- HardFilt: 1 = success. 0 = fail
- PAE_Filt: 1 = success. 0 = fail
- HardCount: A count of the fragments of Hard-edge inside each soft margin
- Hard_Count: Count
- PAECount: A count of the fragments of PAE inside each soft margin
- PAE_Count: Count
- Planet3m: A note that data on the area of bare earth identified from Planet Scope 3m imagery within soft margin follows
- PS_bare: Area of bare soil from Planet Scope (m2)
- PS_pct: Area of Planet Scope 3m bare earth divided by area of soft margin
- ecw_Bare: A note that data on the area of bare earth identified orthophoto RGB imagery within soft margin follows
- ecwBare_m2: Area of bare soil from ecw imagery (m2)
- ecwBarePct: Area of orthophoto bare earth divided by area of soft margin
- Fencing: Length of fencing based on minimum bounding perimeter
- FenceLen: Length (m)
- Clust_10m: A note that data on the clustering of soft margin within 10m of each other follows
- Clust10mID: Alphanumeric Identifier of gully clusters within 10m of each other
- Clust_50m: A note that data on the clustering of soft margin within 50m of each other follows
- Clust50mID: Alphanumeric Identifier of gully clusters within 50m of each other
- Roughness: A note that data on the roughness within each soft margin follows
- Sum_Rough: Sum of Roughness over any eroding pixels
- Sum_RoughA: Sum of roughness normalized to area of soft margin
- SoilClass: A note that data on soil type within each soft margin follows
- Soil_Desc: A brief description of soil type
- Soil_Intgr: Integer classification of soil type
- LandClass: A note that data on landscape classification for each soft margin follows
- Land_Desc: Landscape class is alluvial, colluvial or rugged
- Land_Intgr: Alluvial = 1, colluvial = 2, rugged = 3
References:
Daley, J., Stout, J.C., Curwen, G., Brooks., A.P., Spencer., J., Pietsch., T. and Thwaites, R.. (2021). Development and application of automated tools for high resolution gully mapping and classification from lidar data. PrESM, Griffith University. pp. 138.
Data Location:
This dataset is filed in the eAtlas enduring data repository at: data\custodian\2019-2022-NESP-TWQ-5\5.10_Gully-mapping-classification
Simple
Identification info
- Date (Publication)
- 2021-03-09
- Cited responsible party
-
Role Organisation Name Telephone Delivery point City Administrative area Postal code Country Electronic mail address Principal investigator Coastal and Marine Research Centre, Griffith University Assoc. Prof. Andrew Brooks Voice facsimile Building G51 Room 2.01 Gold Coast Queensland 4111 Australia andrew.brooks@griffith.edu.au
- Point of contact
-
Role Organisation Name Telephone Delivery point City Administrative area Postal code Country Electronic mail address Point of contact Coastal and Marine Research Centre, Griffith University Assoc. Prof. Andrew Brooks Voice facsimile Building G51 Room 2.01 Gold Coast Queensland 4111 Australia andrew.brooks@griffith.edu.au
- Topic category
-
- Biota
Extent
Extent
- Description
- Great Barrier Reef, Australia

Temporal extent
- Time period
- 2018 2019
Resource constraints
- Linkage
-
http://i.creativecommons.org/l/by/3.0/au/88x31.png
License Graphic
- Title
- Creative Commons Attribution 3.0 Australia License
- Cited responsible party
-
Role Organisation Name Telephone Delivery point City Administrative area Postal code Country Electronic mail address
- Website
-
http://creativecommons.org/licenses/by/3.0/au/
License Text
- Language
- English
- Character encoding
- UTF8
Distribution Information
- OnLine resource
- NESP TWQ Hub website Project 5.10
- OnLine resource
- eAtlas Web Mapping Service (WMS) (AIMS)
- OnLine resource
- Project web site
- OnLine resource
- Shapefiles + Metadata + preview image [Zip 32 MB]
- OnLine resource
- Interactive map of this dataset
Metadata constraints
- Linkage
-
http://i.creativecommons.org/l/by/3.0/au/88x31.png
License Graphic
- Title
- Creative Commons Attribution 3.0 Australia License
- Cited responsible party
-
Role Organisation Name Telephone Delivery point City Administrative area Postal code Country Electronic mail address
- Website
-
http://creativecommons.org/licenses/by/3.0/au/
License Text
Metadata
- Metadata identifier
- urn:uuid/ba7a78b5-e262-4ffd-8837-d367fc918db1
- Language
- English
- Character encoding
- UTF8
- Contact
-
Role Organisation Name Telephone Delivery point City Administrative area Postal code Country Electronic mail address Point of contact Australian Institute of Marine Science (AIMS) eAtlas Data Manager Voice facsimile PRIVATE MAIL BAG 3, TOWNSVILLE MAIL CENTRE Townsville Queensland 4810 Australia e-atlas@aims.gov.au
Type of resource
- Resource scope
- Dataset
- Metadata linkage
-
https://eatlas.org.au/data/uuid/ba7a78b5-e262-4ffd-8837-d367fc918db1
Point of truth URL of this metadata record
- Date info (Creation)
- 2021-03-10T00:11:09
- Date info (Revision)
- 2023-09-18T07:46:32
Metadata standard
- Title
- ISO 19115-3:2018