 eAtlas Data Catalogue
irregular
Type of resources
Topics
Keywords
Contact for the resource
Provided by
Years
Representation types
Update frequencies
status
-
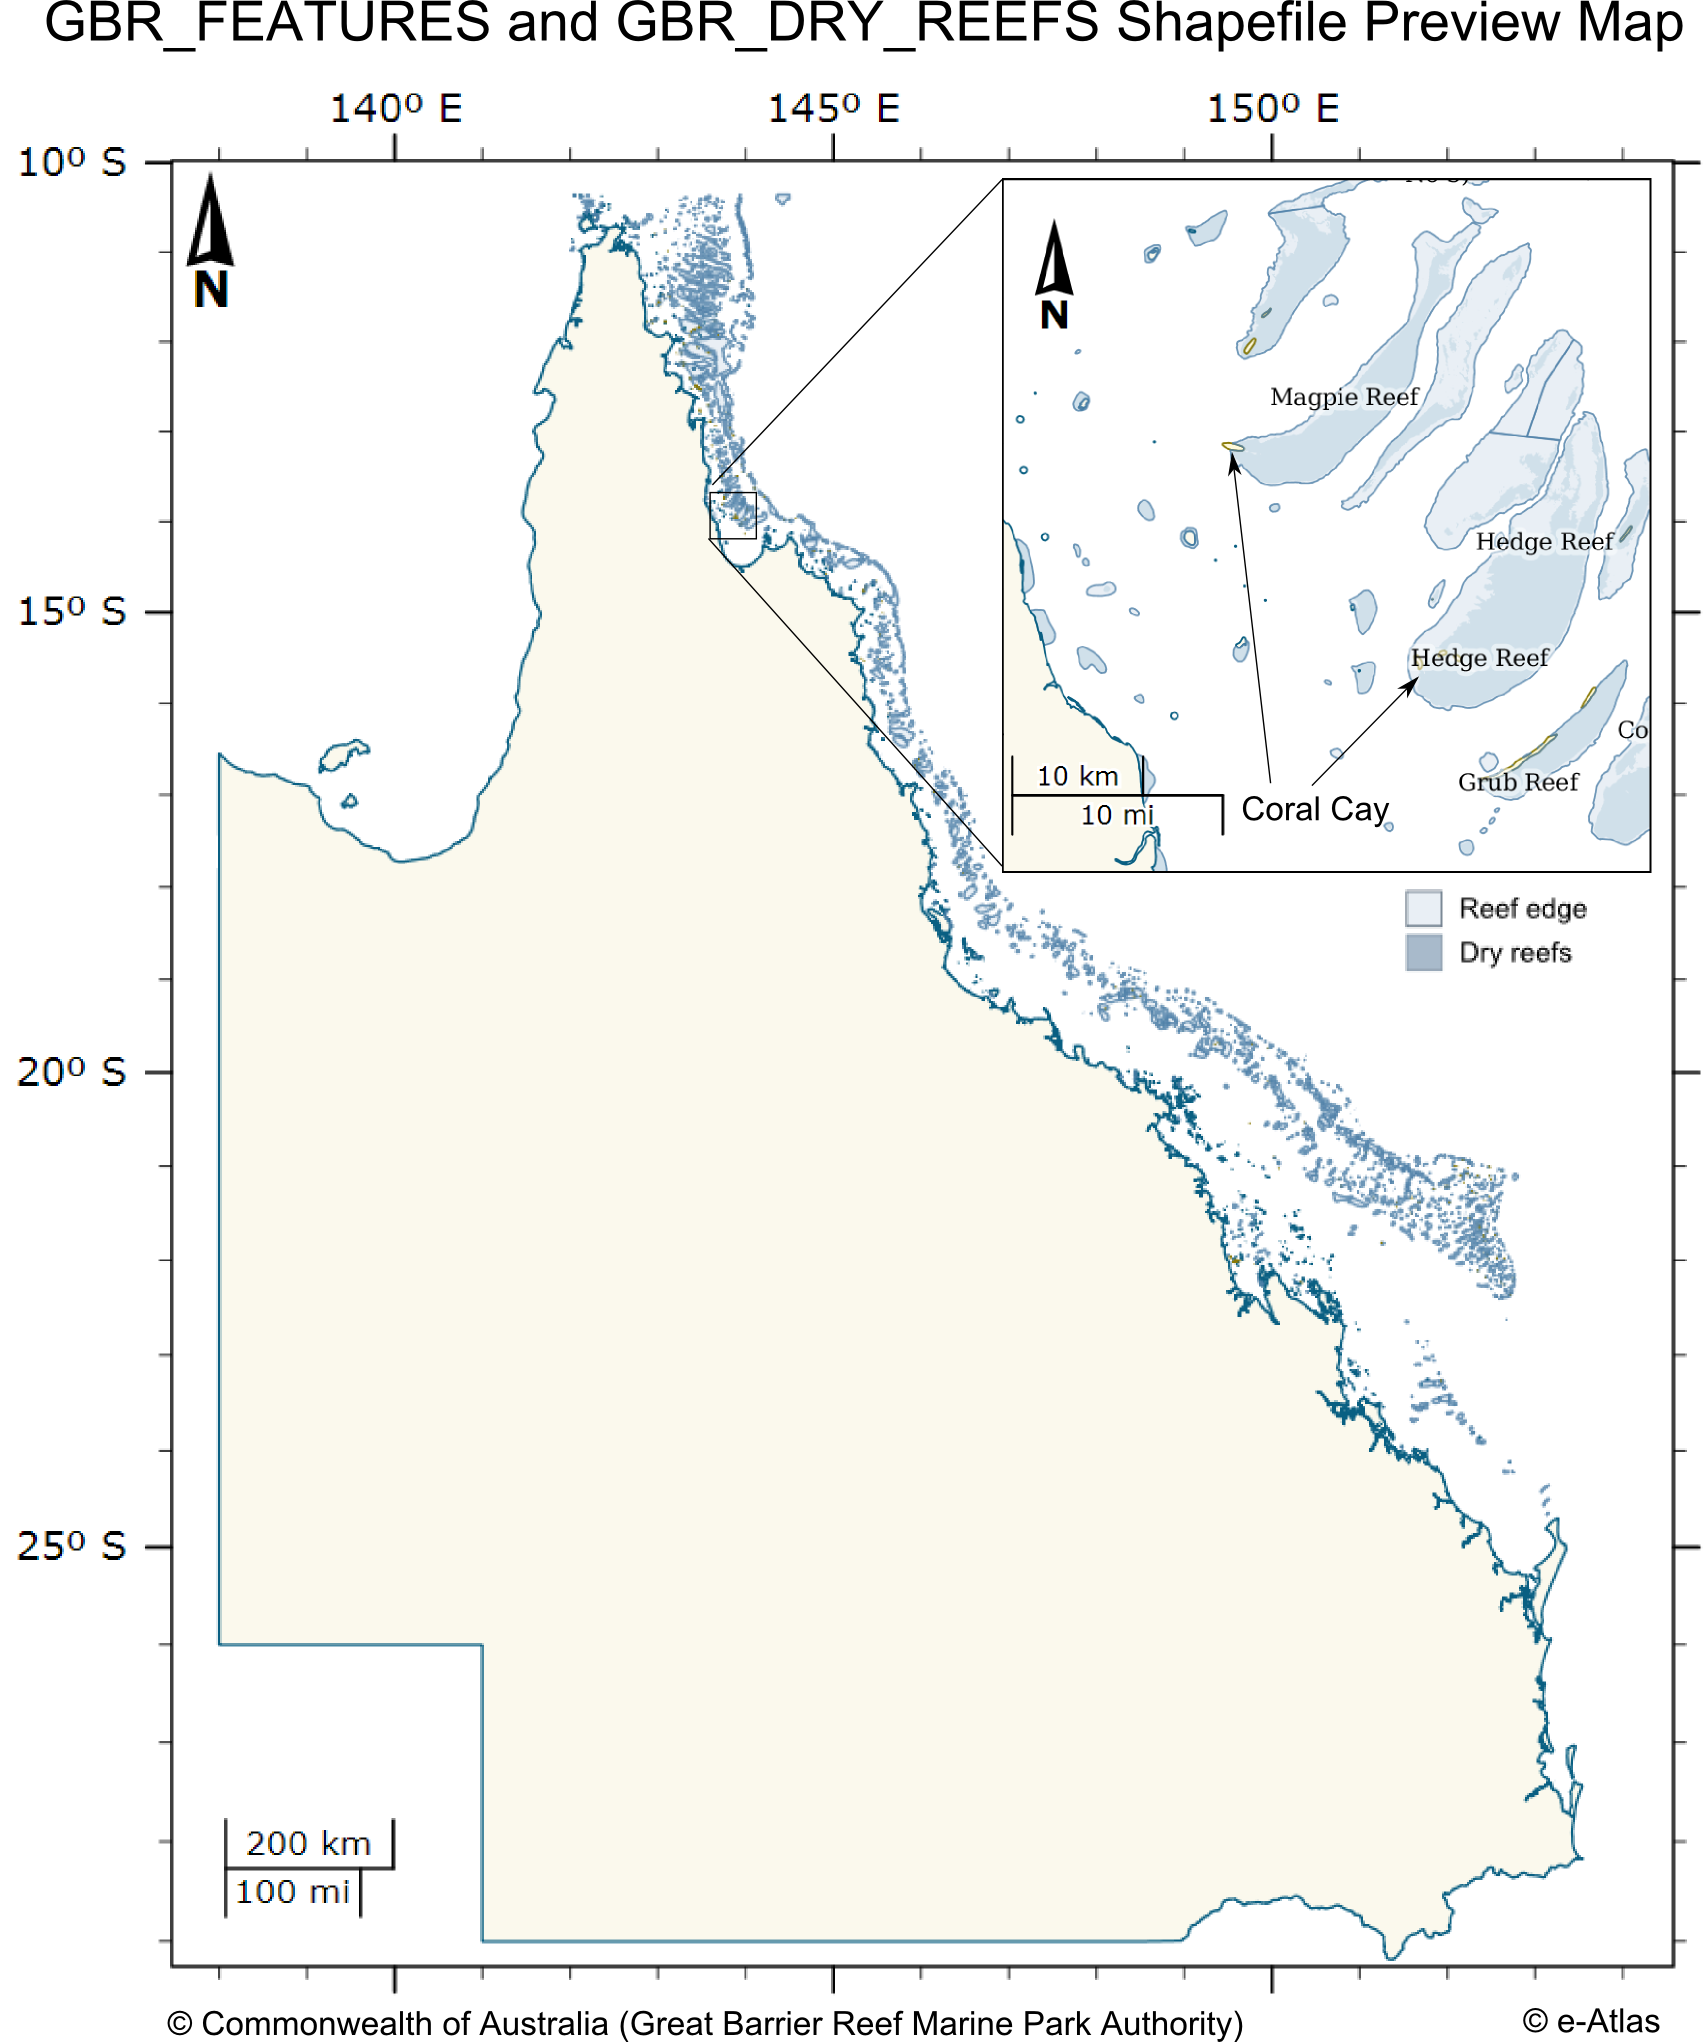
This dataset contains coastal features within and adjacent to the Great Barrier Reef World Heritage area. This dataset consists of two shapefiles GBR_FEATURES.shp and GBR_DRY_REEF.shp. The GBR_FEATURES shapefile contains the following features: * Queensland mainland coastline, * Major and other coral reef structures (as defined by the reef shoal edge), * Islands and rocks (exposed and submerged), * Major coral cay features. The GBR_DRY_REEFS contains major coral reef structures (as defined by the reef shoal edge) that are tidal, drying or emergent reef areas. The reef features extend north above the GBRWHA to just within the Torres Strait region. The features have not been statistically tested with precision survey techniques. Positional accuracy varies considerably and dataset should NOT be used for navigation purposes, however, for general use the coverage can be regarded as having a nominal scale of 1:250,000. This dataset corresponds to the zoning within the Great Barrier Reef Marine Park effective 1st July 2004. It is derived from the Great Barrier Reef Marine Park Zoning Plan 2003. The Great Barrier Reef Marine Park is a multiple-use area. Zoning helps to manage and protect the values of the Marine Park that users enjoy. Zoning Plans define what activities occur in which locations both to protect the marine environment and to separate potentially conflicting activities. Revised zoning of the Great Barrier Reef Marine Park was introduced in July 2004 as part of the Great Barrier Reef Marine Park Authority's Representative Areas Programme. Between 1999 and 2004, the Great Barrier Reef Marine Park Authority undertook a systematic planning and consultative program to develop new zoning for the Marine Park. The primary aim of the program was to better protect the range of biodiversity in the Great Barrier Reef, by increasing the extent of no-take areas (or highly protected areas, locally known as ‘Green Zones’), ensuring they included 'representative' examples of all different habitat types - hence the name, the Representative Areas Program or RAP. Whilst increasing the protection of biodiversity, a further aim was to maximise the benefits and minimise the negative impacts of the rezoning on the existing users of the Marine Park. Both these aims were achieved by a comprehensive program of scientific input, community involvement and innovation [1]. In each zones there are a range of activities that are allowed, disallowed or require a permit. The following outlines a summary of activities that are disallowed in each zone. Please refer to [2] for a more detailed and authoritative description of all restrictions within each zone: * General Use Zone: General use, some activities require a permit. * Habitat Protection Zone: No trawling, some activities require permits. * Conservation Park Zone: No trawling, limited crabbing and line fishing. * Buffer Zone: No aquaculture, bait netting, crabbing, harvesting fishing, collecting, spearfishing, line fishing, netting and trawling. Trolling for pelagic fish is allowed. * Scientific Research Zone: Research areas primarily around scientific research facilities. Same as Buffer zone but with no trolling. * Marine National Park Zone (Green): 'no-take' area. The following are allowed: boating, diving, photography and limited impact research. Some other activities are allowed with permits. * Preservation Zone (Pink): 'no go' area. No activities are allowed except research activities with a permit. Official maps derived from this dataset can be downloaded from the GBRMPA Zoning Maps [3] page. This dataset can now be downloaded directly from GBRMPA's Geoportal. Note: This metadata record was created for the eAtlas and is not authoritative. Please contact GBRMPA for more information. GBR_FEATURES.shp: Polygon Vector Shape file (5376 features) GBR_ID: A number that is made up of a two-digit number representing the latitude band the feature is in (LAT_ID) and a three or four-digit number representing the sequential number of a particular feature complex (GROUP_ID), e.g. an island with an adjacent reef/cay/rock etc should have the same GROUP_ID (19-051) SORT_GBR_I: A whole number for sorting (19051) GBR_NAME: Great Barrier Reef MP Name (Five Trees Cay (No 1)) QLD_NAME: Queensland Name (Five Trees Cay (No 1)) FEATURE_C: a three-digit number representing the type of feature, e,g mainland, island, cay etc (102) FEAT_NAME: Name of feature (Cay, Island, Mainland, Reef, Rock, Sand) SUB_NO: a two-digit number that is linked to the SUB_ID of a feature. The SUB_ID is a letter that identifies multiple features of the same type in a group, e.g. multiple reefs surrounding an island are labelled a, b, c, d etc - these will be numbered 101, 102, 103, 104 etc. If the SUB_ID is "s", it refers to a single feature and will be given the number 100 (101) LABEL_ID: GBR_ID plus SUB_ID if not an S (S is a singular feature and does not need a sub-id label) (19-051a) X_COORD: Centroid of feature (in Geographics GDA94 decimal degrees) (150.221849) Y_COORD: Centroid of feature (in Geographics GDA94 decimal degrees) (-22.227123) CODE: GBR_ID plus SUB_NO plus FEATURE_CODE with hyphens (19-051-101-102) UNIQUE_ID: GBR_ID plus SUB_NO plus FEATURE_CODE with no hyphens. This is to be used as the unique ID for the oracle database (19051102101) GBR_DRY_REEFS.shp: This shows areas of the reef that dry or the tops of the reefs. Polygon Vector Shape file (2318 features)
-
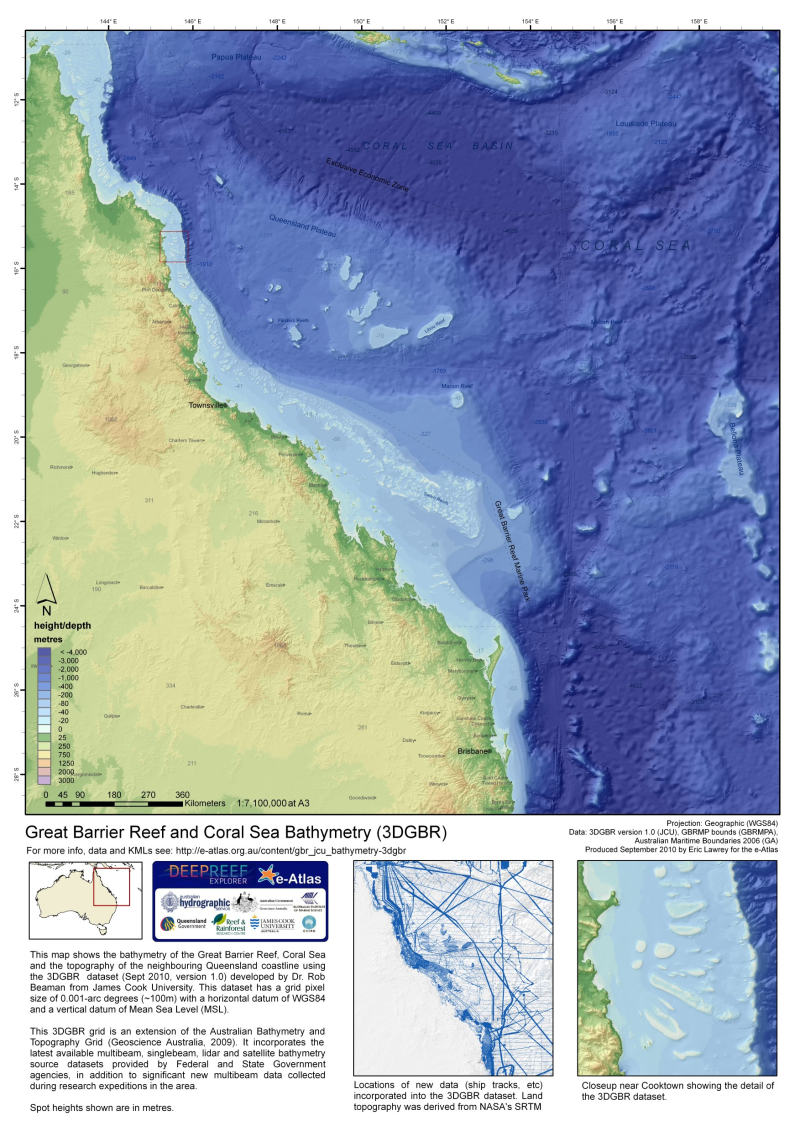
The gbr100 dataset is a high-resolution bathymetry and Digital Elevation Model (DEM) covering the Great Barrier Reef, Coral Sea and neighbouring Queensland coastline. This DEM has a grid pixel size of 0.001-arc degrees (~100m) with a horizontal datum of WGS84 and a vertical datum of Mean Sea Level (MSL). For the latest version of this dataset download the data from http://deepreef.org/bathymetry/65-3dgbr-bathy.html This dataset was developed as part of the 3DGBR project. This grid utilises the latest available multibeam, singlebeam, lidar and satellite bathymetry source datasets provided by Federal and State Government agencies, in addition to significant new multibeam data collected during research expeditions in the area. The large increase in source bathymetry data added much detail to improving the resolution of the current Australian Bathymetry and Topography Grid (Whiteway, 2009). The gbr100 grid provides new insights into the detailed geomorphic shape and spatial relationships between adjacent seabed features. The accompanying report contains an explanation of the various source datasets used in the development of the new grid, and how the data were treated in order to convert to a similar file format with common horizontal (WGS84) and vertical (mean sea level) datums. Descriptive statistics are presented to show the relative proportion of source data used in the new grid. The report continues with a detailed explanation of the pre-processing and gridding process methodology used to develop the grid. A description is also provided for additional spatial analysis on the new grid in order to derive associated grids and layers. The results section provides a short overview of the improvement of the new grid over the current Australian Bathymetry and Topography Grid (Whiteway, 2009). The report then presents the results of the new grid, called gbr100, and the associated derived map outputs as a series of figures. A table of metadata for the current source data accompanies this report as Appendix 1. The report is available at: http://www.deepreef.org/publications/reports/67-3dgbr-final.html Data details and format: gbr100 bathymetry grid: Height/Depth in metres (MSL) Formats: 19000x18000 pixel grid (32 bit float) in ESRI raster grid file, GMT/netCDF grid file, Fledermaus sd file, 100m contour ESRI shapefile, GeoTiff grid file. Total Vertical Uncertainty: Total Vertical Uncertainty (TVU) in the bathymetry estimated from uncertainty classification of each source dataset. Formats: 19000x18000 pixel grid (32 bit float) in ESRI raster, GeoTiff. Hillshading: Hillshading for full gbr100 and also ocean areas only. Derived from the gbr100 grid. Format: 19000x18000 pixel grid (8 bit) in GeoTiff. Funding history: This dataset was initially developed as part of project 2.5i.1 from the MTSRF program (2010). Subsequent versions of the dataset were developed from other funding sources. Version history: - July 2010 - Version 1 Initial release of the DEM. - Dec 2014 - Version 3 This version incorporates dozens of new bathymetric surveys including many new navy LADS surveys and some satellite derived bathy to fill in some gaps left by LADS. - Jan 2016 - Version 4 This version incorporates estimates of bathymetry from satellite imagery in shallow clear waters. - Nov 2020 - Version 6 This revised 3D depth model (V6 – 10 Nov 2020) is a significant improvement on the previous 2017 version, with all offshore reefs mapped with either airborne lidar bathymetry surveys or satellite derived bathymetry. All the available processed multibeam data are now included. Crowdsourced singlebeam bathymetry adds over 50 thousand line km of source data to the inter-reef seafloor. Work will continue to fill the gaps. Data Location: This dataset is filed in the eAtlas enduring data repository at: data\ongoing\GBR_JCU_Beaman_3DGBR-bathymetry-gbr100 Note: Copies of legacy versions 1, 3 and 4 are stored in the eAtlas and available on request. eAtlas Processing: To visualize this dataset on the eAtlas the format of the data was converted from the ESRI ArcInfo grid format into a GeoTiff format. This was done by loading the data in ArcMap then exporting it as a GeoTiff image. Overview images and final compression options were then performed using GDAL tools.