 eAtlas Data Catalogue
2013
Type of resources
Topics
Keywords
Contact for the resource
Provided by
Years
Formats
Representation types
status
-
This dataset is a composite of Landsat 5 satellite imagery to produce a cloud free, clear water seamless image of the Torres Strait region. This image includes some of Cape York and PNG, in particular the Fly river. This composite shows clear imagery for marine areas, in particular reefs, larger islands and sand bars. This image has a resolution of approximately 30 m and a positional accuracy of better than 50 m. There is a new similar dataset based on higher resolution Sentinel 2 imagery: Lawrey, E. (2022). Torres Strait Sentinel 2 Satellite Regional Maps and Imagery 2015 – 2021 (AIMS) [Data set]. eAtlas. https://doi.org/10.26274/3CGE-NV85 This composite is made from 8 Landsat scenes. Images in each scene were selected by trawling through the entire archive of Landsat 5 to find the clearest two to three clearest images. The preference for these images was that they needed to be as cloud free as possible, be at low tide and for the water to be as clear as possible. The final images used range from 1993 - 2009. The selected images were converted to true colour, corrected for sun glint, high level thin clouds and haze. The two or three images for a scene were then blended together in Photoshop using feathered masks to remove clouded areas. The images were then colour and tonally corrected to match neighbouring scenes. The scenes were then blended by copying cropped feathered versions of the neighbouring scenes. The resulting images for each scene were then masked to create a clean "no data" boundary around the image so that mosaicking would not introduce any visual artefacts. The scene images were then mosaicked together into a single image using gdalwarp. The final image was then reprojected using gdalwarp and finally trimmed and compressed using gdal_translate.
-
This dataset contains a series of high resolution raster Digital Elevation Models (DEM) (1m resolution) around the coastal perimeter of Torres Strait community islands (Badu, Boigu, Dauan, Erub, Hammond, Iama, Mabuiag, Masig, Mer, Moa, Poruma, Saibai, Ugar, Warraber). This dataset was developed for the purpose of mapping levels of coastal inundation under different sea level rise and storm tide scenarios. To enable the creation of maps of the various scenarios from the DEM the Highest Astronomical Tide (HAT) and storm surge values for 1yr, 100yr and 1000yr Annual Return Interval (ARI) relative to the Mean Sea Level (MSL) for each island were compiled from Harper (2011). These height thresholds are provided in spreadsheet format. The DEM dataset was produced predominantly from LiDAR (light detection and ranging) surveys taken in 2011 and provided to the Torres Strait Regional Authority (TSRA) by the Department of Natural Resources and Mines, Queensland Government. LiDAR data is a remote sensing technology that measures distance by illuminating a target with a laser and analysing the reflected light. For the Torres Strait region LiDAR aircraft were used to collect height values above sea level to gain a very accurate and detailed coverage of the terrain of the islands captured. The data captured was then modelled using ArcMap software to calculate a DEM for each island. Due to the large size of some of the islands only areas subject to inundation were processed and included in this dataset. The XYZ LiDAR data was captured and grouped into 1x1km tiles. These 1x1km areas were then merged to follow the coastline of each island from 1 data file for small islands, such as Masig through to 49 files for large islands such as Saibai. The entire dataset is made up from 112 separate DEM files. The XYZ data was converted to TIN files, then transformed from TIN to a DEM raster. The DEM raster has a projection of GDA94 / MGA Zone 55. The height datum used in this dataset is the Australian Height Datum (AHD) which approximates to Mean Sea Level (MSL). Height datums in the Torres Strait have been unofficially revised by DERM from a Spatial Infrastructure Audit that was conducted in 2011. The raster files are intended to be displayed by classifying different levels of coastal inundation as specified in Harper (2011). Each island has a different conversions between MSL to HAT and storm surge levels. These must be applied appropriately to the DEM of each island in order to assess the potential inundation hazards. Limitations: The LiDAR used to create the DEM did not measure heights below the level of the water at the time that the measurements were taken. As a result the DEM cuts off at the level of the tide when the LiDAR was taken. For some islands the DEM goes down to below the Mean Sea Level (MSL), while in others it only goes down to the MSL+0.6m. This makes this dataset unsuitable for investigating low tide effects. In addition to this the DEM is not clipped to the coastline and so areas that were covered in water the DEM shows an interpolation between the heights of closest neighbouring coastline (due to the TIN process). This must be considered when using this dataset for a purpose other than looking at high tide conditions. In this dataset most of the base data was from LiDAR data. However for the Moa communities of Saint Pauls and Kubin no LiDAR data was available and so datasets developed by Dr Kevin Parnell from Schlenker Orthophotography were used instead. This data that was captured in 1999. This data is not as accurate as LiDAR data and this should be kept in mind when analysing these areas. A tender has been released for capture of LiDAR data for Saint Pauls and Kubin to occur in 2014. References: Harper Bruce, Mason Luciano, Botev Ivan, Smith Mitchell, Callaghan Jeff (2011). "Torres Strait Extreme Water Level Study". Systems Engineering Australia Pty Ltd. Accessible from http://www.tsra.gov.au/__data/assets/pdf_file/0006/2004/tsewls_finalreport_lowres.pdf
-
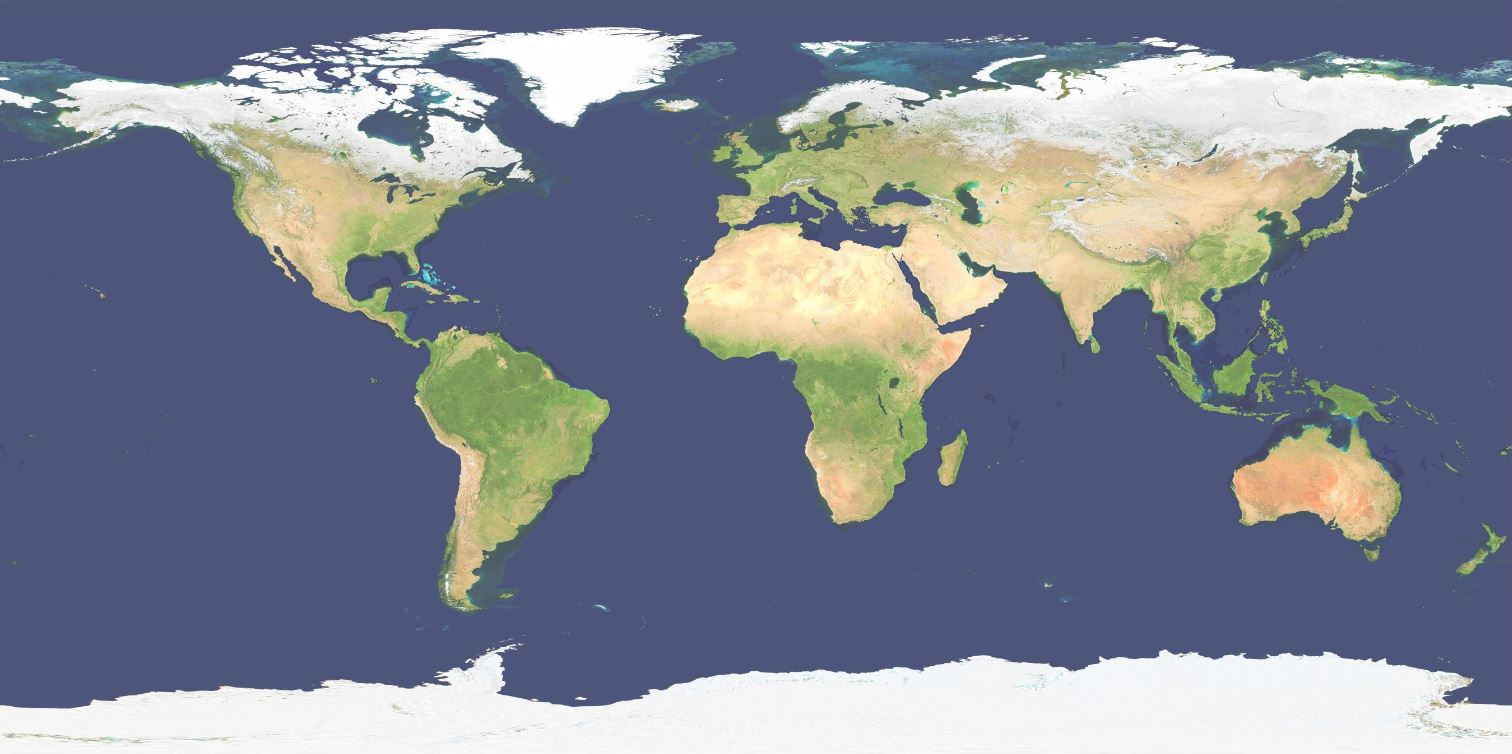
This layer shows a 500m resolution image of the world derived from the Blue Marble Next Generation April 2004 image (86400x43200 pixels). As the image was derived from MODIS satellite imagery during Autumn in the Northern Hemisphere the high latitude countries (Russia, Canada, etc) are covered in snow. The colour and tonal range of the original Blue Marble image was compressed and brightened to make the image suitable for use as a basemap. In addition to this noise filtering was applied to de-clutter the image somewhat to make it more suitable as a layer under hillshading, with the aim of the layer being to provide colour to the hillshading. The processing of the images was performed in Photoshop and the geo-referencing and final preparation was done using GDAL. This image is made available as a 357 MB JPEG compressed GeoTiff file as part of the Bright Earth basemap dataset.