 eAtlas Data Catalogue
2016
Type of resources
Topics
Keywords
Contact for the resource
Provided by
Years
Representation types
Update frequencies
status
Scale
-
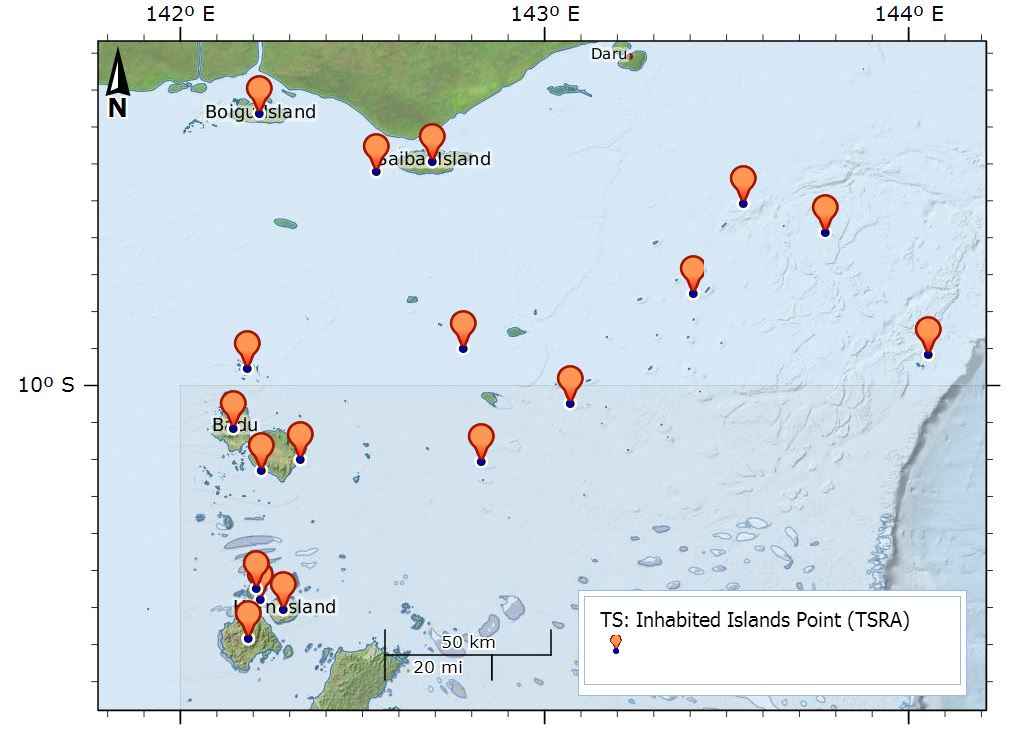
This dataset shows the point location of communities on Torres Strait Islands. There are 18 Islands in the Torres Strait and 19 Communities. St Pauls and Kubin villages are both located on Moa Island. Each point includes an URL attribute pointing to the community pages on the TSRA website. The Island Communities are: Boigu Island, Warraber Island, Ugar Island, Thursday Island, Saibai Island, Poruma Island, Prince of Wales Island, Mer Island, Masig Island, Mabuiag Island, Iama Island, Horn Island, Hammond Island, Erub Island, Dauan Island, Badu Island, St Pauls, Moa Island, Kubin, Moa Island The dataset is a point shapefile, created in ArcGIS Version 10.0. Data Dictionary: - URL: URL to the community page for the island on the TSRA website. - Region: Region within Torres Strait (Northern islands, Central islands, Eastern islands, Southern islands, Western islands) from the Torres Strait Island Regional Council. - Pop2011: Population of each island from the 2011 census. Data Location: This dataset is filed in the eAtlas enduring data repository at: data\TSRA\TS_TSRA_Inhabited-Islands_2014 Change Log: - V2 21-03-2016 (Eric Lawrey, AIMS): Added Regions and population statistics.
-
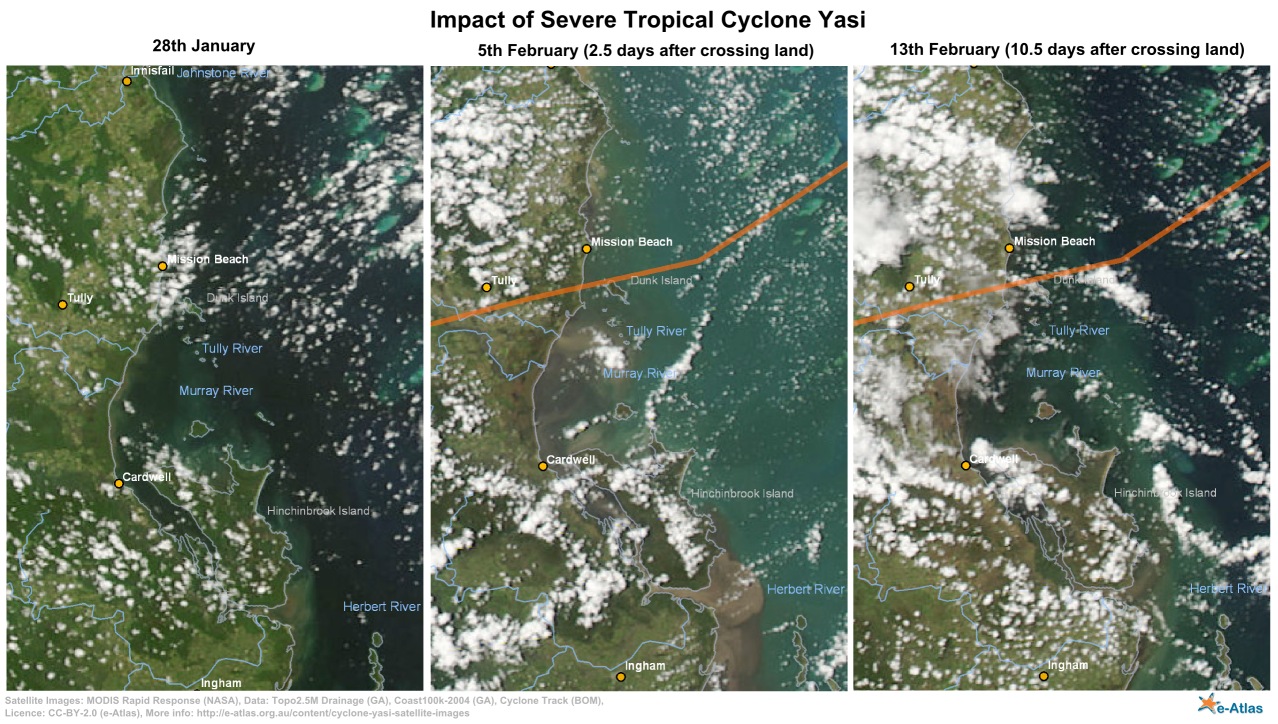
This collection is a record of MODIS satellite imagery before, during and after severe cyclone Yasi in February 2011. This image series highlights the damage the cyclone makes to the rainforest areas around mission beach and the turbulence created off shore by the cyclone on the 5th February (2.5 days after the cyclone). It corresponds to the images and maps from the "Cyclone Yasi satellite image maps - before and after" article in the eAtlas. Use this dataset if you wish to recreate these maps. The imagery in this collection was sourced from the NASA rapid response site and consists of georeferenced JPEG images. This collection contains the raw georeferenced satellite imagery as well as a number of maps that include rivers, towns, coastline and cyclone Yasi's track. The data used to create these maps is included in the data package. This includes Australian Coast100k 2004 (Geoscience Australia), Australian Topo2M5-2003 Drainage (Geoscience Australia), Natural earth 10m Cities and Yasi track BOM (Bureau of Meteorology). This series contains images for 28th January, 2nd February (1 day before land crossing), 5th February (2.5 days after crossing land) and 13th February (10.5 days after crossing land). These images cover most of the Great Barrier Reef, the coral sea and the Queensland coastline. Format: This dataset contains original georeferenced NASA Rapid Response JPEG images (6400x6400 pixels), shapefiles for Coast 100k, Topo 2M5 Drainage, 10m cities and Yasi track. It also contains the original Yasi track as locations and an R script to convert this to a shapefile. It also contains an ArcMap MXD file that uses all the data files to create the maps that combine the satellite imagery with the shapefiles; these maps are provided in JPEG and PNG exports. Additonally it contains an SVG (Scalar Vector Graphic) file (made in Inkscape) for creating the before and after comparison map. The maps are based on the follow NASA Rapid Response images: Australia3.2011028.terra.250m Australia3.2011033.aqua.250m Australia3.2011036.aqua.250m Australia3.2011043.aqua.250m Change Log: 2016-05-16 - Corrected the date labels in some of the exported maps. Three of then were labelled with 2010 instead of the correct year 2011. Repository Location: This dataset is saved in the eAtlas enduring data repository at: data\NERP-TE\13.1_eAtlas\GBR_eAtlas-NASA_Yasi-before-after-MODIS_2011
-
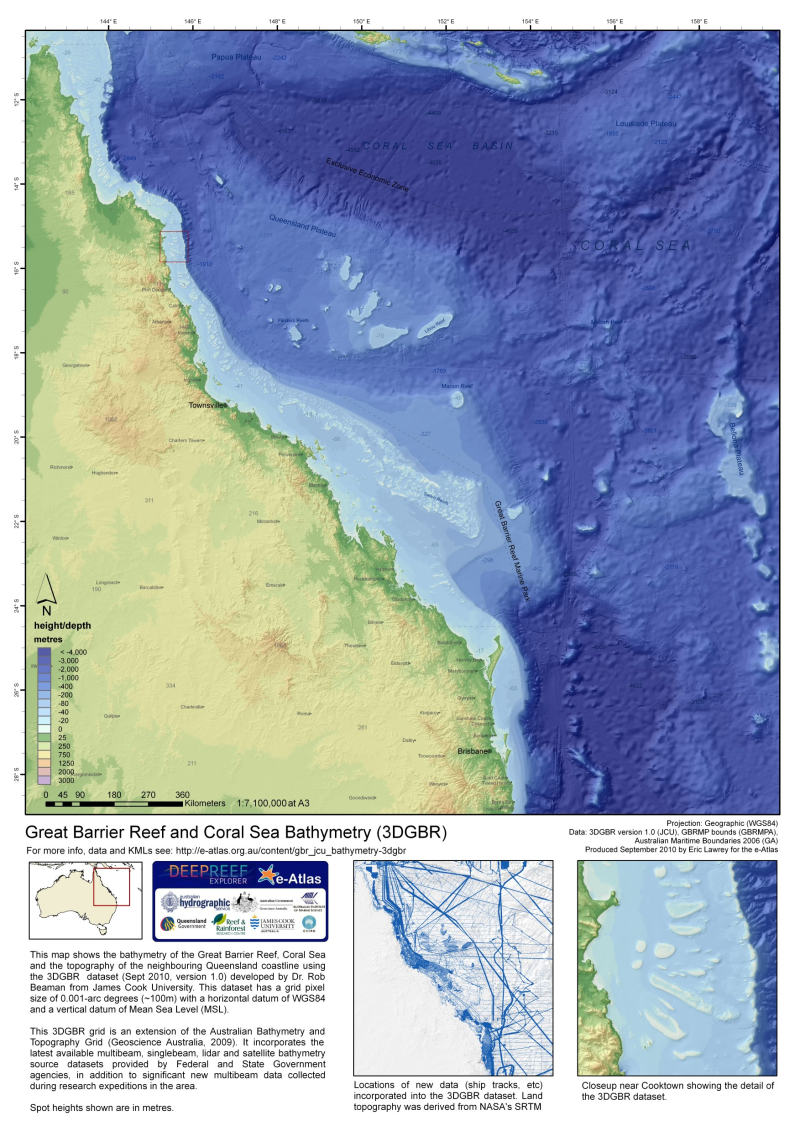
The gbr100 dataset is a high-resolution bathymetry and Digital Elevation Model (DEM) covering the Great Barrier Reef, Coral Sea and neighbouring Queensland coastline. This DEM has a grid pixel size of 0.001-arc degrees (~100m) with a horizontal datum of WGS84 and a vertical datum of Mean Sea Level (MSL). For the latest version of this dataset download the data from http://deepreef.org/bathymetry/65-3dgbr-bathy.html This dataset was developed as part of the 3DGBR project. This grid utilises the latest available multibeam, singlebeam, lidar and satellite bathymetry source datasets provided by Federal and State Government agencies, in addition to significant new multibeam data collected during research expeditions in the area. The large increase in source bathymetry data added much detail to improving the resolution of the current Australian Bathymetry and Topography Grid (Whiteway, 2009). The gbr100 grid provides new insights into the detailed geomorphic shape and spatial relationships between adjacent seabed features. The accompanying report contains an explanation of the various source datasets used in the development of the new grid, and how the data were treated in order to convert to a similar file format with common horizontal (WGS84) and vertical (mean sea level) datums. Descriptive statistics are presented to show the relative proportion of source data used in the new grid. The report continues with a detailed explanation of the pre-processing and gridding process methodology used to develop the grid. A description is also provided for additional spatial analysis on the new grid in order to derive associated grids and layers. The results section provides a short overview of the improvement of the new grid over the current Australian Bathymetry and Topography Grid (Whiteway, 2009). The report then presents the results of the new grid, called gbr100, and the associated derived map outputs as a series of figures. A table of metadata for the current source data accompanies this report as Appendix 1. The report is available at: http://www.deepreef.org/publications/reports/67-3dgbr-final.html Data details and format: gbr100 bathymetry grid: Height/Depth in metres (MSL) Formats: 19000x18000 pixel grid (32 bit float) in ESRI raster grid file, GMT/netCDF grid file, Fledermaus sd file, 100m contour ESRI shapefile, GeoTiff grid file. Total Vertical Uncertainty: Total Vertical Uncertainty (TVU) in the bathymetry estimated from uncertainty classification of each source dataset. Formats: 19000x18000 pixel grid (32 bit float) in ESRI raster, GeoTiff. Hillshading: Hillshading for full gbr100 and also ocean areas only. Derived from the gbr100 grid. Format: 19000x18000 pixel grid (8 bit) in GeoTiff. Funding history: This dataset was initially developed as part of project 2.5i.1 from the MTSRF program (2010). Subsequent versions of the dataset were developed from other funding sources. Version history: - July 2010 - Version 1 Initial release of the DEM. - Dec 2014 - Version 3 This version incorporates dozens of new bathymetric surveys including many new navy LADS surveys and some satellite derived bathy to fill in some gaps left by LADS. - Jan 2016 - Version 4 This version incorporates estimates of bathymetry from satellite imagery in shallow clear waters. - Nov 2020 - Version 6 This revised 3D depth model (V6 – 10 Nov 2020) is a significant improvement on the previous 2017 version, with all offshore reefs mapped with either airborne lidar bathymetry surveys or satellite derived bathymetry. All the available processed multibeam data are now included. Crowdsourced singlebeam bathymetry adds over 50 thousand line km of source data to the inter-reef seafloor. Work will continue to fill the gaps. Data Location: This dataset is filed in the eAtlas enduring data repository at: data\ongoing\GBR_JCU_Beaman_3DGBR-bathymetry-gbr100 Note: Copies of legacy versions 1, 3 and 4 are stored in the eAtlas and available on request. eAtlas Processing: To visualize this dataset on the eAtlas the format of the data was converted from the ESRI ArcInfo grid format into a GeoTiff format. This was done by loading the data in ArcMap then exporting it as a GeoTiff image. Overview images and final compression options were then performed using GDAL tools.