 eAtlas Data Catalogue
2017
Type of resources
Topics
Keywords
Contact for the resource
Provided by
Years
Representation types
Update frequencies
status
-
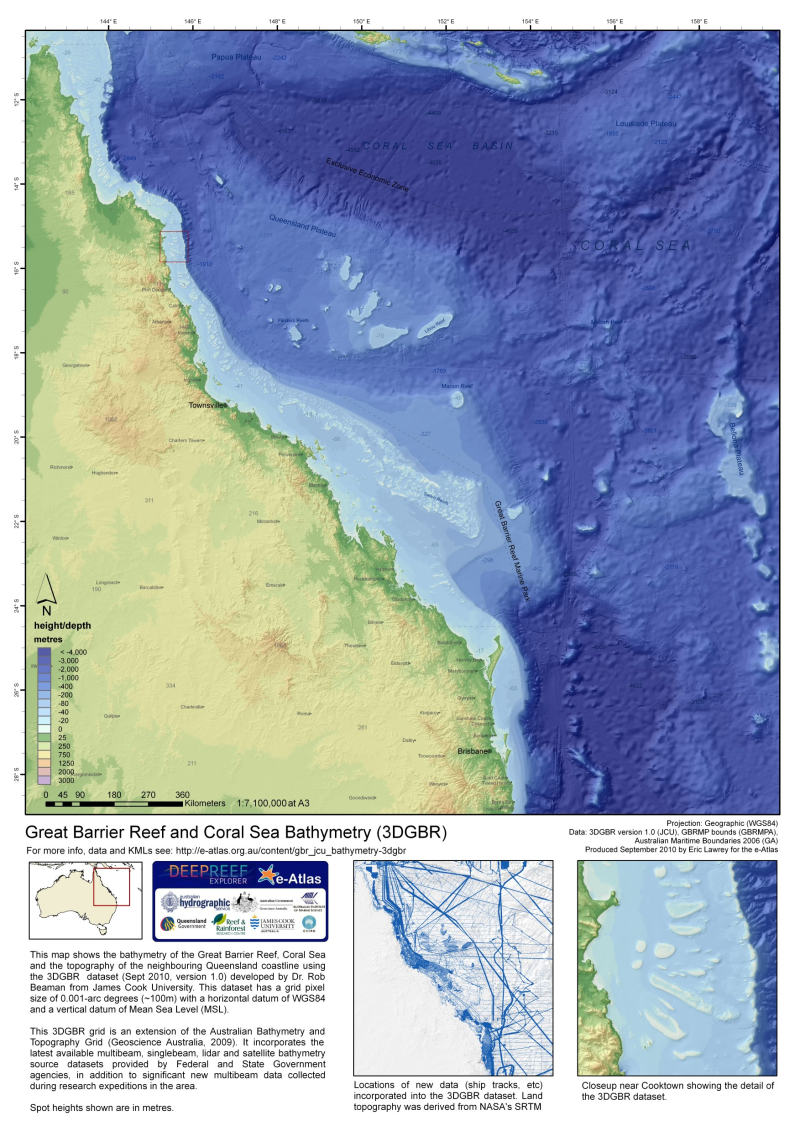
The gbr100 dataset is a high-resolution bathymetry and Digital Elevation Model (DEM) covering the Great Barrier Reef, Coral Sea and neighbouring Queensland coastline. This DEM has a grid pixel size of 0.001-arc degrees (~100m) with a horizontal datum of WGS84 and a vertical datum of Mean Sea Level (MSL). For the latest version of this dataset download the data from http://deepreef.org/bathymetry/65-3dgbr-bathy.html This dataset was developed as part of the 3DGBR project. This grid utilises the latest available multibeam, singlebeam, lidar and satellite bathymetry source datasets provided by Federal and State Government agencies, in addition to significant new multibeam data collected during research expeditions in the area. The large increase in source bathymetry data added much detail to improving the resolution of the current Australian Bathymetry and Topography Grid (Whiteway, 2009). The gbr100 grid provides new insights into the detailed geomorphic shape and spatial relationships between adjacent seabed features. The accompanying report contains an explanation of the various source datasets used in the development of the new grid, and how the data were treated in order to convert to a similar file format with common horizontal (WGS84) and vertical (mean sea level) datums. Descriptive statistics are presented to show the relative proportion of source data used in the new grid. The report continues with a detailed explanation of the pre-processing and gridding process methodology used to develop the grid. A description is also provided for additional spatial analysis on the new grid in order to derive associated grids and layers. The results section provides a short overview of the improvement of the new grid over the current Australian Bathymetry and Topography Grid (Whiteway, 2009). The report then presents the results of the new grid, called gbr100, and the associated derived map outputs as a series of figures. A table of metadata for the current source data accompanies this report as Appendix 1. The report is available at: http://www.deepreef.org/publications/reports/67-3dgbr-final.html Data details and format: gbr100 bathymetry grid: Height/Depth in metres (MSL) Formats: 19000x18000 pixel grid (32 bit float) in ESRI raster grid file, GMT/netCDF grid file, Fledermaus sd file, 100m contour ESRI shapefile, GeoTiff grid file. Total Vertical Uncertainty: Total Vertical Uncertainty (TVU) in the bathymetry estimated from uncertainty classification of each source dataset. Formats: 19000x18000 pixel grid (32 bit float) in ESRI raster, GeoTiff. Hillshading: Hillshading for full gbr100 and also ocean areas only. Derived from the gbr100 grid. Format: 19000x18000 pixel grid (8 bit) in GeoTiff. Funding history: This dataset was initially developed as part of project 2.5i.1 from the MTSRF program (2010). Subsequent versions of the dataset were developed from other funding sources. Version history: - July 2010 - Version 1 Initial release of the DEM. - Dec 2014 - Version 3 This version incorporates dozens of new bathymetric surveys including many new navy LADS surveys and some satellite derived bathy to fill in some gaps left by LADS. - Jan 2016 - Version 4 This version incorporates estimates of bathymetry from satellite imagery in shallow clear waters. - Nov 2020 - Version 6 This revised 3D depth model (V6 – 10 Nov 2020) is a significant improvement on the previous 2017 version, with all offshore reefs mapped with either airborne lidar bathymetry surveys or satellite derived bathymetry. All the available processed multibeam data are now included. Crowdsourced singlebeam bathymetry adds over 50 thousand line km of source data to the inter-reef seafloor. Work will continue to fill the gaps. Data Location: This dataset is filed in the eAtlas enduring data repository at: data\ongoing\GBR_JCU_Beaman_3DGBR-bathymetry-gbr100 Note: Copies of legacy versions 1, 3 and 4 are stored in the eAtlas and available on request. eAtlas Processing: To visualize this dataset on the eAtlas the format of the data was converted from the ESRI ArcInfo grid format into a GeoTiff format. This was done by loading the data in ArcMap then exporting it as a GeoTiff image. Overview images and final compression options were then performed using GDAL tools.