 eAtlas Data Catalogue
150000
Type of resources
Topics
Keywords
Contact for the resource
Provided by
Years
Representation types
Update frequencies
status
Scale
-
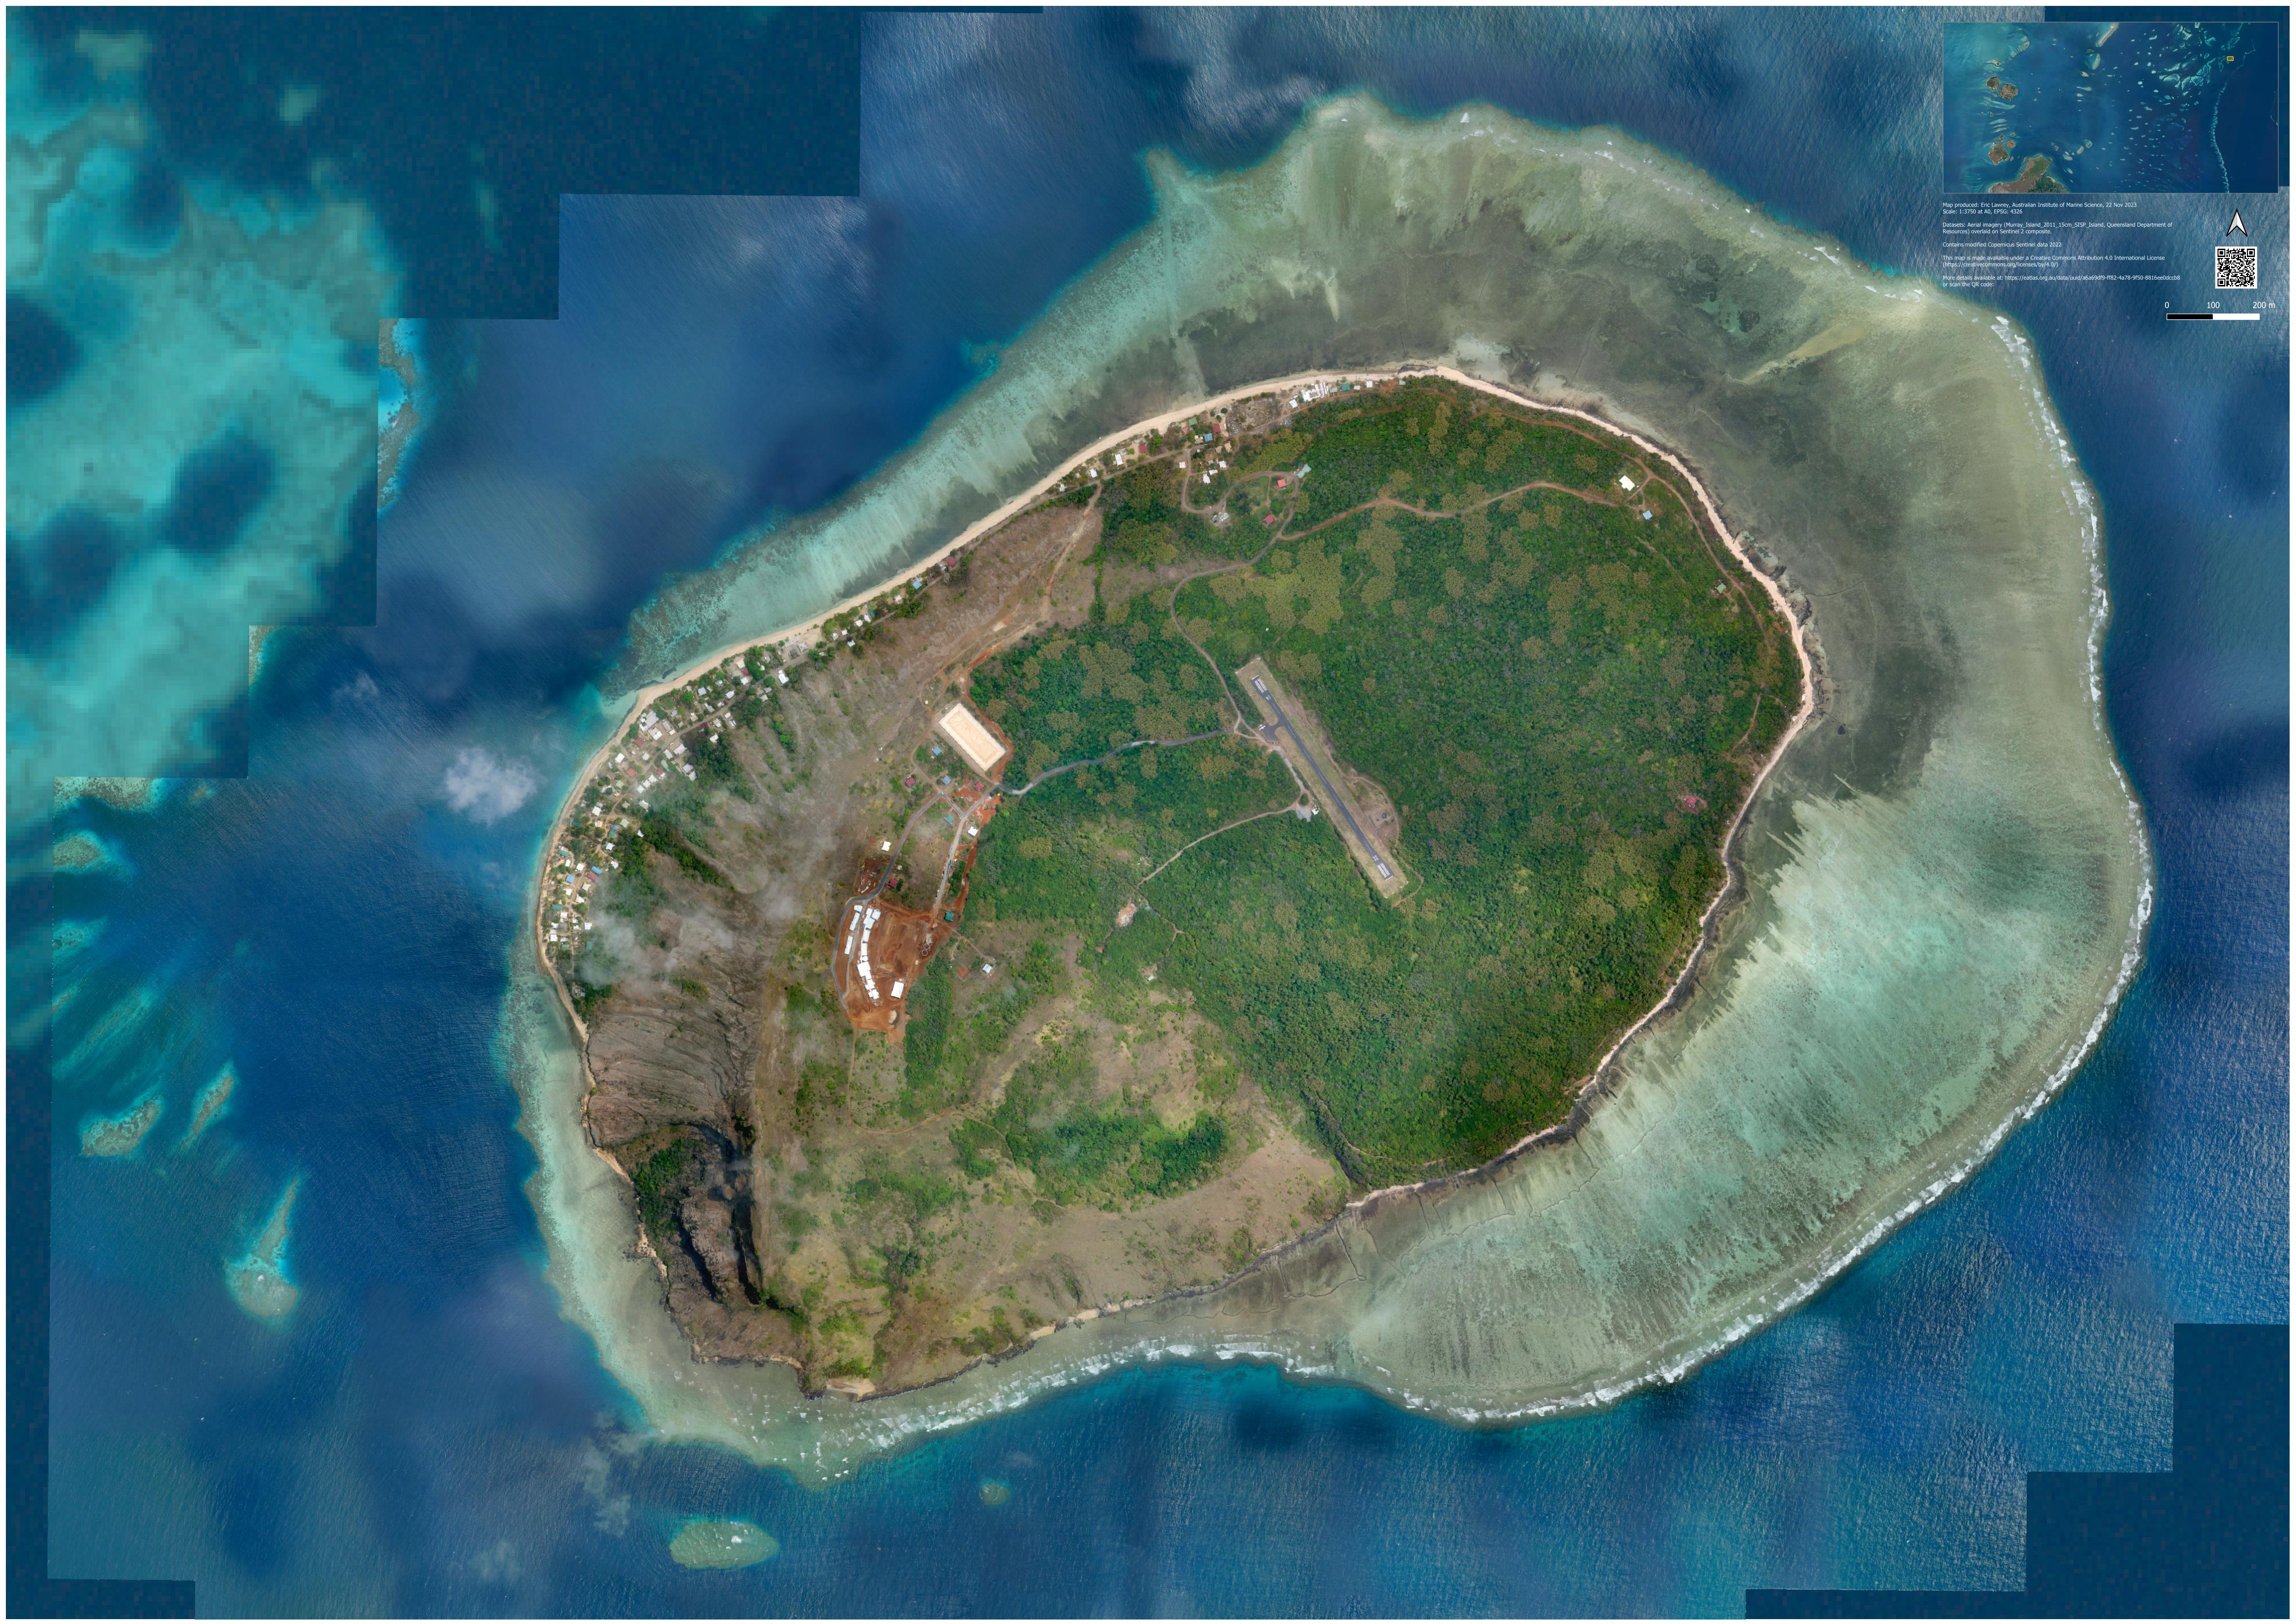
This dataset contains both large (A0) printable maps of the Torres Strait broken into six overlapping regions, based on a clear sky, clear water composite Sentinel 2 composite imagery and the imagery used to create these maps. These maps show satellite imagery of the region, overlaid with reef and island boundaries and names. Not all features are named, just the more prominent features. This also includes a vector map of Ashmore Reef and Boot Reef in Coral Sea as these were used in the same discussions that these maps were developed for. The map of Ashmore Reef includes the atoll platform, reef boundaries and depth polygons for 5 m and 10 m. This dataset contains all working files used in the development of these maps. This includes all a copy of all the source datasets and all derived satellite image tiles and QGIS files used to create the maps. This includes cloud free Sentinel 2 composite imagery of the Torres Strait region with alpha blended edges to allow the creation of a smooth high resolution basemap of the region. The base imagery is similar to the older base imagery dataset: Torres Strait clear sky, clear water Landsat 5 satellite composite (NERP TE 13.1 eAtlas, AIMS, source: NASA). Most of the imagery in the composite imagery from 2017 - 2021. Method: The Sentinel 2 basemap was produced by processing imagery from the World_AIMS_Marine-satellite-imagery dataset (not yet published) for the Torres Strait region. The TrueColour imagery for the scenes covering the mapped area were downloaded. Both the reference 1 imagery (R1) and reference 2 imagery (R2) was copied for processing. R1 imagery contains the lowest noise, most cloud free imagery, while R2 contains the next best set of imagery. Both R1 and R2 are typically composite images from multiple dates. The R2 images were selectively blended using manually created masks with the R1 images. This was done to get the best combination of both images and typically resulted in a reduction in some of the cloud artefacts in the R1 images. The mask creation and previewing of the blending was performed in Photoshop. The created masks were saved in 01-data/R2-R1-masks. To help with the blending of neighbouring images a feathered alpha channel was added to the imagery. The processing of the merging (using the masks) and the creation of the feathered borders on the images was performed using a Python script (src/local/03-merge-R2-R1-images.py) using the Pillow library and GDAL. The neighbouring image blending mask was created by applying a blurring of the original hard image mask. This allowed neighbouring image tiles to merge together. The imagery and reference datasets (reef boundaries, EEZ) were loaded into QGIS for the creation of the printable maps. To optimise the matching of the resulting map slight brightness adjustments were applied to each scene tile to match its neighbours. This was done in the setup of each image in QGIS. This adjustment was imperfect as each tile was made from a different combinations of days (to remove clouds) resulting in each scene having a different tonal gradients across the scene then its neighbours. Additionally Sentinel 2 has slight stripes (at 13 degrees off the vertical) due to the swath of each sensor having a slight sensitivity difference. This effect was uncorrected in this imagery. Single merged composite GeoTiff: The image tiles with alpha blended edges work well in QGIS, but not in ArcGIS Pro. To allow this imagery to be used across tools that don't support the alpha blending we merged and flattened the tiles into a single large GeoTiff with no alpha channel. This was done by rendering the map created in QGIS into a single large image. This was done in multiple steps to make the process manageable. The rendered map was cut into twenty 1 x 1 degree georeferenced PNG images using the Atlas feature of QGIS. This process baked in the alpha blending across neighbouring Sentinel 2 scenes. The PNG images were then merged back into a large GeoTiff image using GDAL (via QGIS), removing the alpha channel. The brightness of the image was adjusted so that the darkest pixels in the image were 1, saving the value 0 for nodata masking and the boundary was clipped, using a polygon boundary, to trim off the outer feathering. The image was then optimised for performance by using internal tiling and adding overviews. A full breakdown of these steps is provided in the README.md in the 'Browse and download all data files' link. The merged final image is available in `export\TS_AIMS_Torres Strait-Sentinel-2_Composite.tif`. Change Log: 2023-03-02: Eric Lawrey Created a merged version of the satellite imagery, with no alpha blending so that it can be used in ArcGIS Pro. It is now a single large GeoTiff image. The Google Earth Engine source code for the World_AIMS_Marine-satellite-imagery was included to improve the reproducibility and provenance of the dataset, along with a calculation of the distribution of image dates that went into the final composite image. A WMS service for the imagery was also setup and linked to from the metadata. A cross reference to the older Torres Strait clear sky clear water Landsat composite imagery was also added to the record. 22 Nov 2023: Eric Lawrey Added the data and maps for close up of Mer. - 01-data/TS_DNRM_Mer-aerial-imagery/ - preview/Torres-Strait-Mer-Map-Landscape-A0.jpeg - exports/Torres-Strait-Mer-Map-Landscape-A0.pdf Updated 02-Torres-Strait-regional-maps.qgz to include the layout for the new map. Source datasets: Complete Great Barrier Reef (GBR) Island and Reef Feature boundaries including Torres Strait Version 1b (NESP TWQ 3.13, AIMS, TSRA, GBRMPA), https://eatlas.org.au/data/uuid/d2396b2c-68d4-4f4b-aab0-52f7bc4a81f5 Geoscience Australia (2014b), Seas and Submerged Lands Act 1973 - Australian Maritime Boundaries 2014a - Geodatabase [Dataset]. Canberra, Australia: Author. https://creativecommons.org/licenses/by/4.0/ [license]. Sourced on 12 July 2017, https://dx.doi.org/10.4225/25/5539DFE87D895 Basemap/AU_GA_AMB_2014a/Exclusive_Economic_Zone_AMB2014a_Limit.shp The original data was obtained from GA (Geoscience Australia, 2014a). The Geodatabase was loaded in ArcMap. The Exclusive_Economic_Zone_AMB2014a_Limit layer was loaded and exported as a shapefile. Since this file was small no clipping was applied to the data. Geoscience Australia (2014a), Treaties - Australian Maritime Boundaries (AMB) 2014a [Dataset]. Canberra, Australia: Author. https://creativecommons.org/licenses/by/4.0/ [license]. Sourced on 12 July 2017, http://dx.doi.org/10.4225/25/5539E01878302 Basemap/AU_GA_Treaties-AMB_2014a/Papua_New_Guinea_TSPZ_AMB2014a_Limit.shp The original data was obtained from GA (Geoscience Australia, 2014b). The Geodatabase was loaded in ArcMap. The Papua_New_Guinea_TSPZ_AMB2014a_Limit layer was loaded and exported as a shapefile. Since this file was small no clipping was applied to the data. AIMS Coral Sea Features (2022) - DRAFT This is a draft version of this dataset. The region for Ashmore and Boot reef was checked. The attributes in these datasets haven't been cleaned up. Note these files should not be considered finalised and are only suitable for maps around Ashmore Reef. Please source an updated version of this dataset for any other purpose. CS_AIMS_Coral-Sea-Features/CS_Names/Names.shp CS_AIMS_Coral-Sea-Features/CS_Platform_adj/CS_Platform.shp CS_AIMS_Coral-Sea-Features/CS_Reef_Boundaries_adj/CS_Reef_Boundaries.shp CS_AIMS_Coral-Sea-Features/CS_Depth/CS_AIMS_Coral-Sea-Features_Img_S2_R1_Depth5m_Coral-Sea.shp CS_AIMS_Coral-Sea-Features/CS_Depth/CS_AIMS_Coral-Sea-Features_Img_S2_R1_Depth10m_Coral-Sea.shp Murray Island 20 Sept 2011 15cm SISP aerial imagery, Queensland Spatial Imagery Services Program, Department of Resources, Queensland This is the high resolution imagery used to create the map of Mer. Marine satellite imagery (Sentinel 2 and Landsat 8) (AIMS), https://eatlas.org.au/data/uuid/5d67aa4d-a983-45d0-8cc1-187596fa9c0c - `World_AIMS_Marine-satellite-imagery` Data Location: This dataset is filed in the eAtlas enduring data repository at: data\custodian\2020-2029-AIMS\TS_AIMS_Torres-Strait-Sentinel-2-regional-maps. On the eAtlas server it is stored at eAtlas GeoServer\data\2020-2029-AIMS.