 eAtlas Data Catalogue
2000000
Type of resources
Topics
Keywords
Contact for the resource
Provided by
Years
Representation types
status
Scale
-
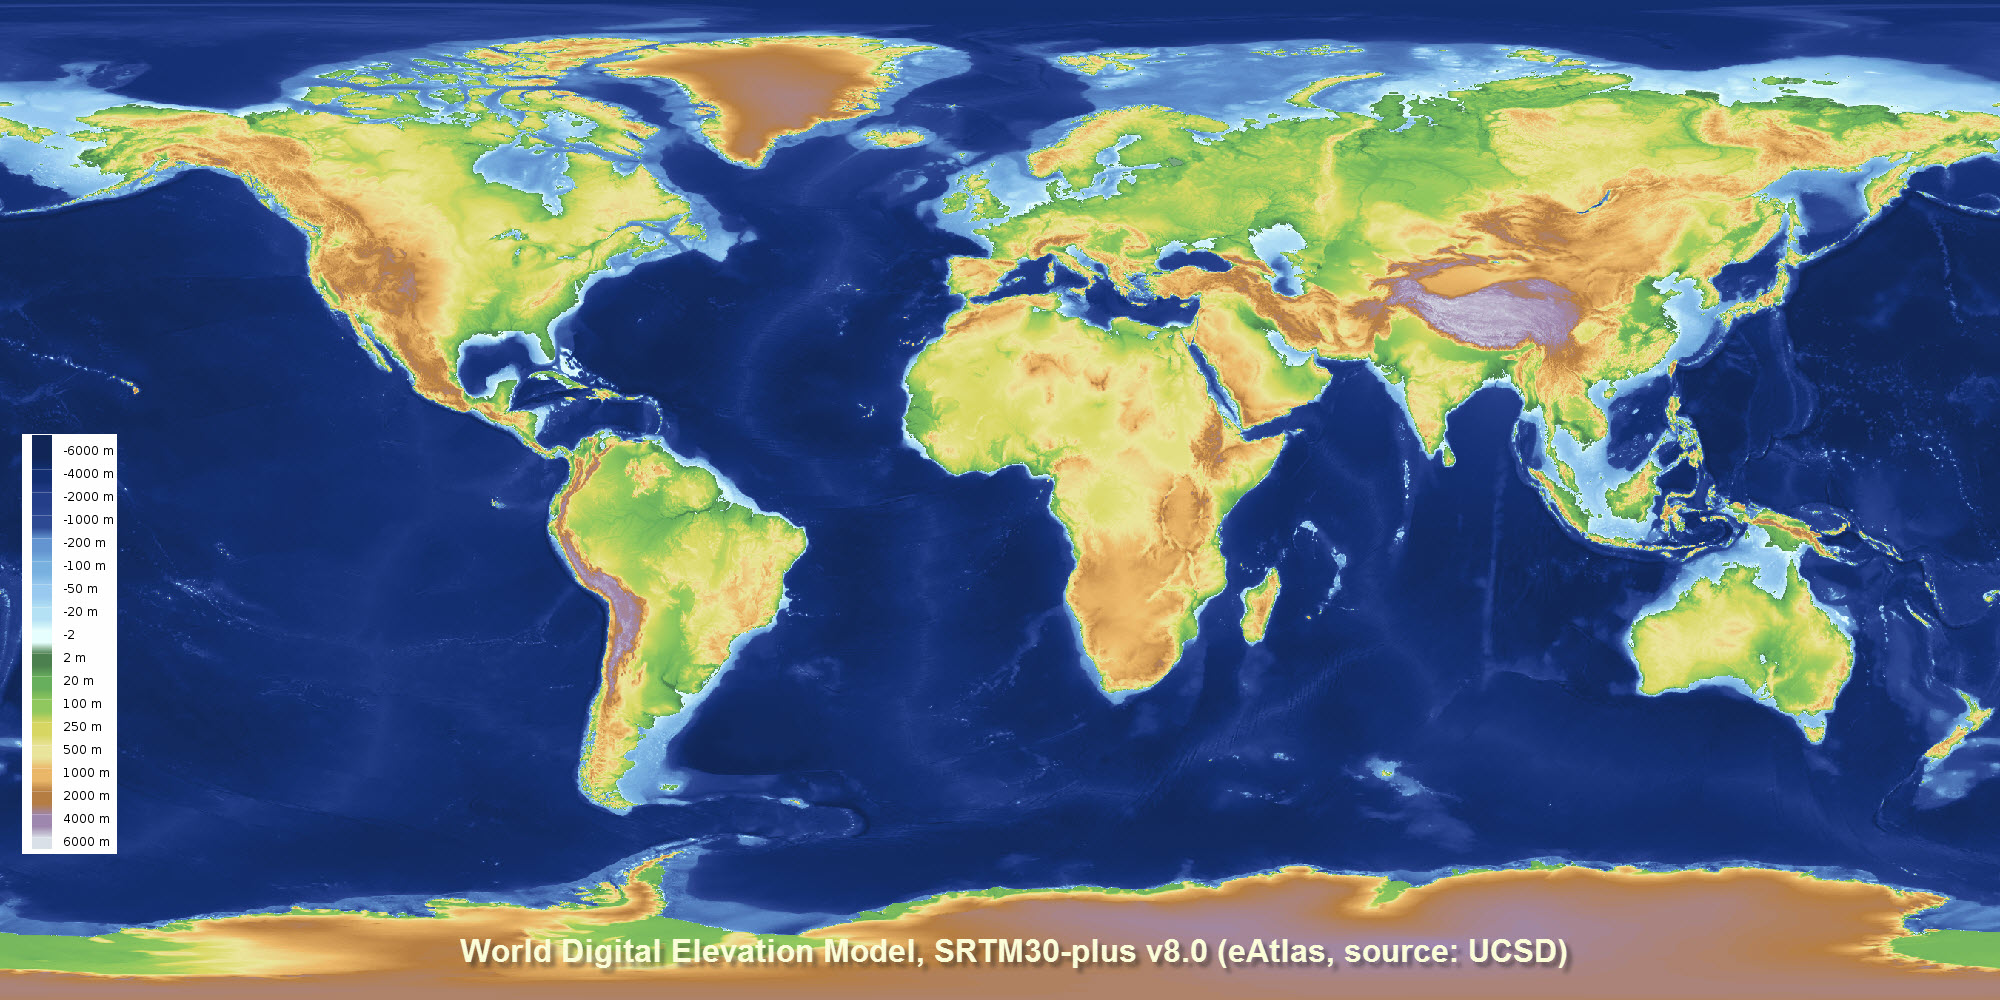
This dataset corresponds to a reformatting of the SRTM30_PLUS digital elevation dataset from 33 NetCDF files into a single GeoTiff for use in GIS applications. No other modifications to the data were done. The rest of this metadata describes the original SRTM30_PLUS dataset itself. Note: The SRTM15_plus dataset is a similar more recent, higher resolution bathymetry dataset https://topex.ucsd.edu/WWW_html/srtm15_plus.html. This dataset is a 30-arc second resolution global topography/bathymetry grid (SRTM30_PLUS) developed from a wide variety of data sources. Land and ice topography comes from the SRTM30 and ICESat topography, respectively. Ocean bathymetry is based on a new satellite-gravity model where the gravity-to-topography ratio is calibrated using 298 million edited soundings. The main contribution of this dataset is the compilation and editing of the raw soundings, which come from NOAA, individual scientists, SIO, NGA, JAMSTEC, IFREMER, GEBCO, and NAVOCEANO. The SRTM30_PLUS dataset developed by Scripps Institute Of Oceanography, University of California San Diego (UCSD). Land data are based on the 1-km averages of topography derived from the USGS SRTM30 grided DEM data product created with data from the NASA Shuttle Radar Topography Mission. GTOPO30 data are used for high latitudes where SRTM data are not available. Ocean data are based on the Smith and Sandwell global 1-minute grid between latitudes +/- 81 degrees. Higher resolution grids have been added from the LDEO Ridge Multibeam Synthesis Project, the JAMSTEC Data Site for Research Cruises, and the NGDC Coastal Relief Model. Arctic bathymetry is from the International Bathymetric Chart of the Oceans (IBCAO) [Jakobsson et al., 2003]. This data consists of 33 files of global topography in the same format as the SRTM30 products distributed by the USGS EROS data center. The grid resolution is 30 second which is roughly one kilometer. In addition the global data are also available in a single large file ready for GMT and as 33 NetCDF files. The eAtlas has also merged and formatted the data as a single GeoTiff file with overviews (1.6 GB). The pixel-registered data are stored in 33 files with names corresponding to the upper left corner of the array shown below. The data are also merged into a single large (1.9 Gbyte, 2-byte integer) file as well as smaller 1-minute and 2-minute netcdf versions. Matching files of source identification number are available for determining the data source for every pixel. This new version (v8.0) includes all of the multibeam bathymetry data collected by U.S. research vessels over the past three decades including 287 Scripps expeditions from research vessels Washington, Melville and Revelle. UCSD undergraduate student Alexis Shakas processed all the U.S. multibeam data and then worked with Google researchers on the global integration. The data is available from UCSD FTP server as 33 NetCDF files and from the eAtlas as a merged GeoTiff. If you are after high resolution bathymetry/elevation data for regional areas please check the related links. Reference, sounding data: Becker, J. J., D. T. Sandwell, W. H. F. Smith, J. Braud, B. Binder, J. Depner, D. Fabre, J. Factor, S. Ingalls, S-H. Kim, R. Ladner, K. Marks, S. Nelson, A. Pharaoh, R. Trimmer, J. Von Rosenberg, G. Wallace, P. Weatherall., Global Bathymetry and Elevation Data at 30 Arc Seconds Resolution: SRTM30_PLUS, Marine Geodesy, 32:4, 355-371, 2009. http://topex.ucsd.edu/sandwell/publications/124_MG_Becker.pdf Reference, gravity data: Sandwell, D. T., and W. H. F. Smith, Global marine gravity from retracked Geosat and ERS-1 altimetry: Ridge Segmentation versus spreading rate, J. Geophys. Res., 114, B01411, doi:10.1029/2008JB006008, 2009. http://dx.doi.org/10.1029/2008JB006008 eAtlas Processing: A set of Batch scripts were developed to perform the conversion of the data from NetCDF to GeoTiff and the generation of the hillshading. This processing was based on the GDAL command line tools. Full details of the processing can be found in the downloadable Scripts associated with this dataset. Data Location: This dataset is filed in the eAtlas enduring data repository at: data\NERP-TE\13.1_eAtlas\World_UCSD_SRTM30-plus
-
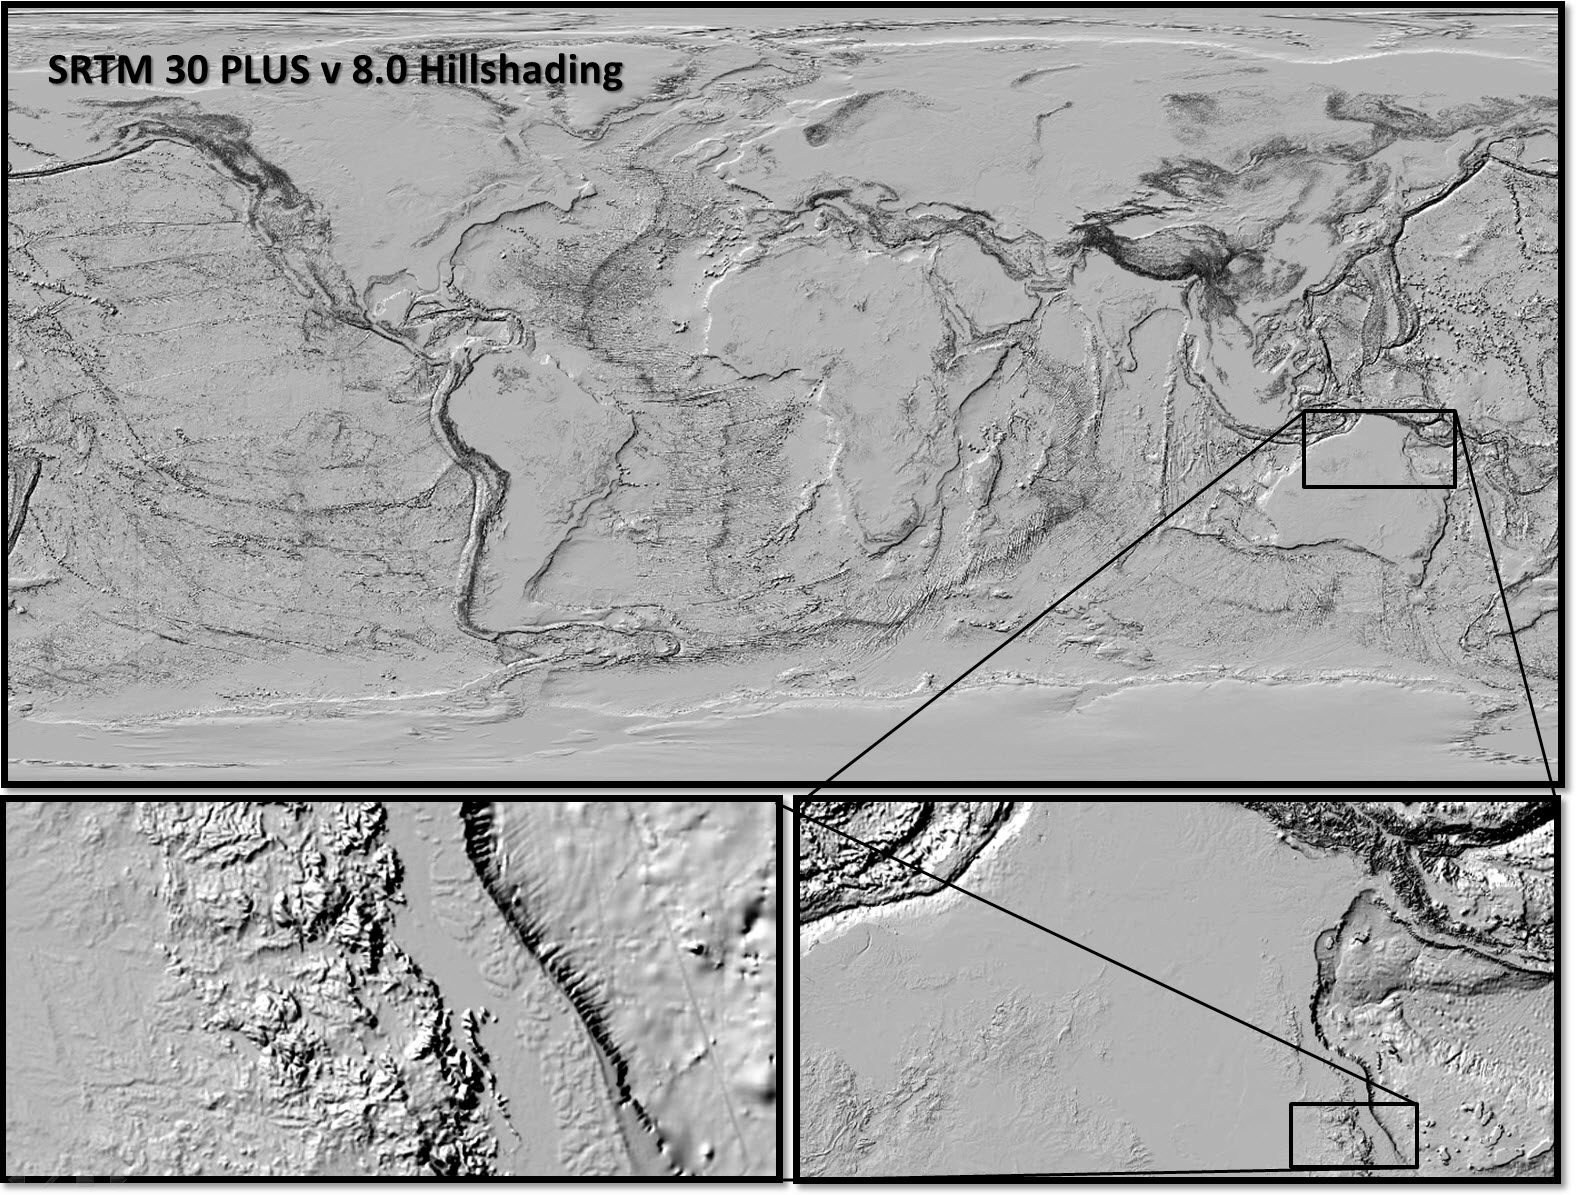
This dataset consists reprocessing and reformatting the SRTM30 PLUS v8.0 Digital Elevation Model (DEM) dataset developed by Scripps Institute Of Oceanography, University of California San Diego (UCSD) to produce a single raster covering the globe in GeoTiff format and create a full and low resolution hillshading from this DEM. The aim of this derived dataset is to reformat the data to allow easy use with GIS applications. Full resolution hillshading: The hillshading was produced by combining the 33 source DEMs using gdal_translate then processing using gdaldem with a z-factor of 0.0001. This output was then formatted as a JPEG compressed GeoTiff file with internal overviews (World_e-Atlas-UCSD_SRTM30-plus_v8_Hillshading.tif). Low resolution smoothed hillshading: A lower resolution of the hillshading (World_e-Atlas-UCSD_SRTM30-plus_v8_Hillshading-lr.tif) was also produced for for use when displaying zoomed out global maps. By making the hillshading smoother the bulk features (mountain ranges, etc) are easier to see. This was generated by subsampling the DEM by two times (down to 21600x10800 pixels) then smoothing it with a pixel Gaussian filter. This was achieved using gdalwarp to subsample the data. Gdalbuildvrt was then used to create a virtual dataset that included a 4 pixel Gaussian filter kernel. The hillshading was then applied to this filtered data source using gdaldem with a z-factor of 0.0003, which 3 times stronger than the high resolution version of this dataset.
-
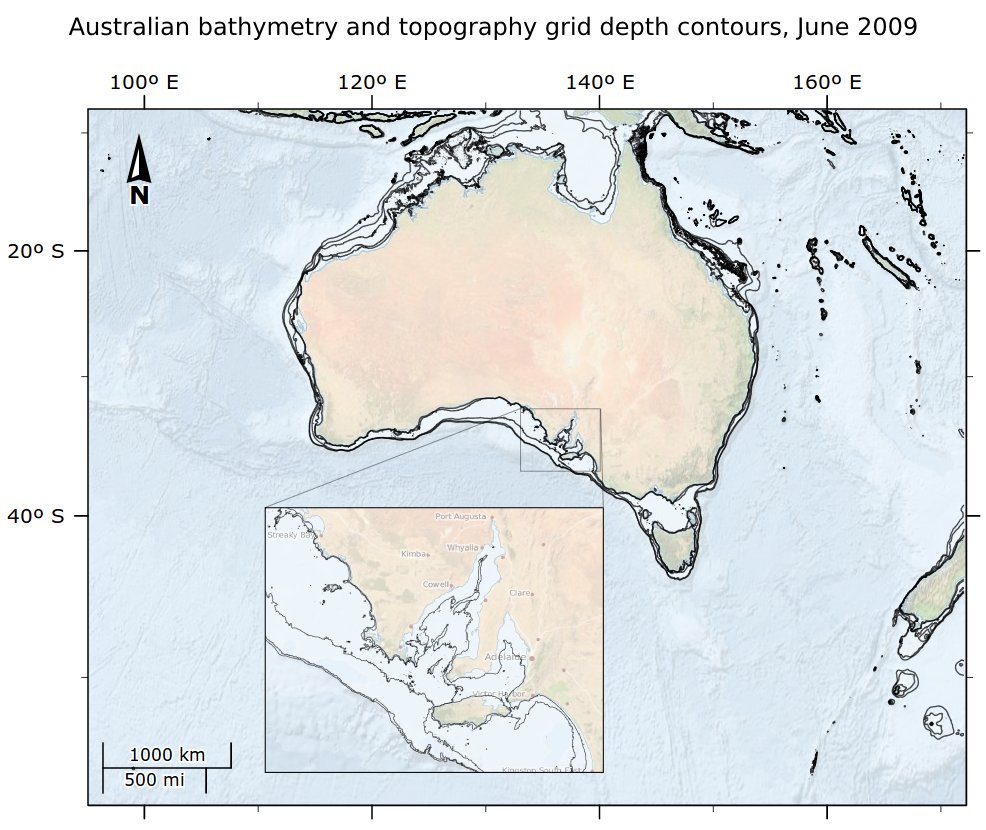
This dataset contains contours generated from the Australian bathymetry and topography grid, June 2009 version 4 by Geoscience Australia. It contains depth contours for -20m, -40m, -100m, -200m and -400m. Contours were generated in ArcMap using the Spatial Analyst Tools / Surface / Contour List tool. This output was then simplified using the Cartography Tools / Generalization / Smooth Line with a tolerance of 300m. The rest of this documentation is based on the metadata of the Australian bathymetry and topography grid itself. This grid is available from GA at http://dx.doi.org/10.4225/25/53D99B6581B9A . In 2005 Geoscience Australia and the National Oceans Office undertook a joint project to produce a consistent, high-quality 9 arc second (0.0025 deg or ~250m at the equator) bathymetric grid for Australian waters. In 2009 a number of new datasets were included in an updated version of the grid. The 2009 bathymetric grid of Australia has been produced to include recently acquired datasets, and solutions to issues identified in the previous version. The revised grid has the same extents as its 2005 counterpart, including the Australian water column jurisdiction lying between 92 deg E and 172 deg E, and 8 deg S and 60 deg S. The waters adjacent to the continent of Australia and Tasmania are included, as are areas surrounding Macquarie Island, and the Australian Territories of Norfolk Island, Christmas Island, and Cocos (Keeling) Islands. The area selected does not include Australia's marine jurisdiction offshore from the Territory of Heard and McDonald Islands and the Australian Antarctic Territory. This report details the datasets and procedures used to produce the 2009 bathymetric grid of Australia. As per the 2005 grid, the 0.0025 decimal degree (dd) resolution is only supported where direct bathymetric observations are sufficiently dense (e.g. where swath bathymetry data or digitised chart data exist) (Webster and Petkovic, 2005). In areas where no sounding data are available (in waters off the Australian shelf), the grid is based on the 2 arc minute ETOPO (Smith and Sandwell, 1997) and 1 arc minute ETOPO (Amante and Eakins, 2008) satellite derived bathymetry. The topographic data (on shore data) is based on the revised Australian 0.0025dd topography grid (Geoscience Australia, 2008), the 0.0025dd NZ topography grid (Geographx, 2008) and the 90m SRTM DEM (Jarvis et al, 2008). The final dataset has been provided in ESRI grid and ER Mapper (ers) formats. An associated shapefile has been produced so that the user can identify the input datasets that were used in the final grid. Data Location: This dataset is filed in the eAtlas enduring data repository at: data\other\AU_GA_Bathymetry-2009\derived\AU_e-Atlas-GA_Bathymetry-2009_Contours