 eAtlas Data Catalogue
MARINE
Type of resources
Topics
Keywords
Contact for the resource
Provided by
Years
Formats
Representation types
Update frequencies
status
-
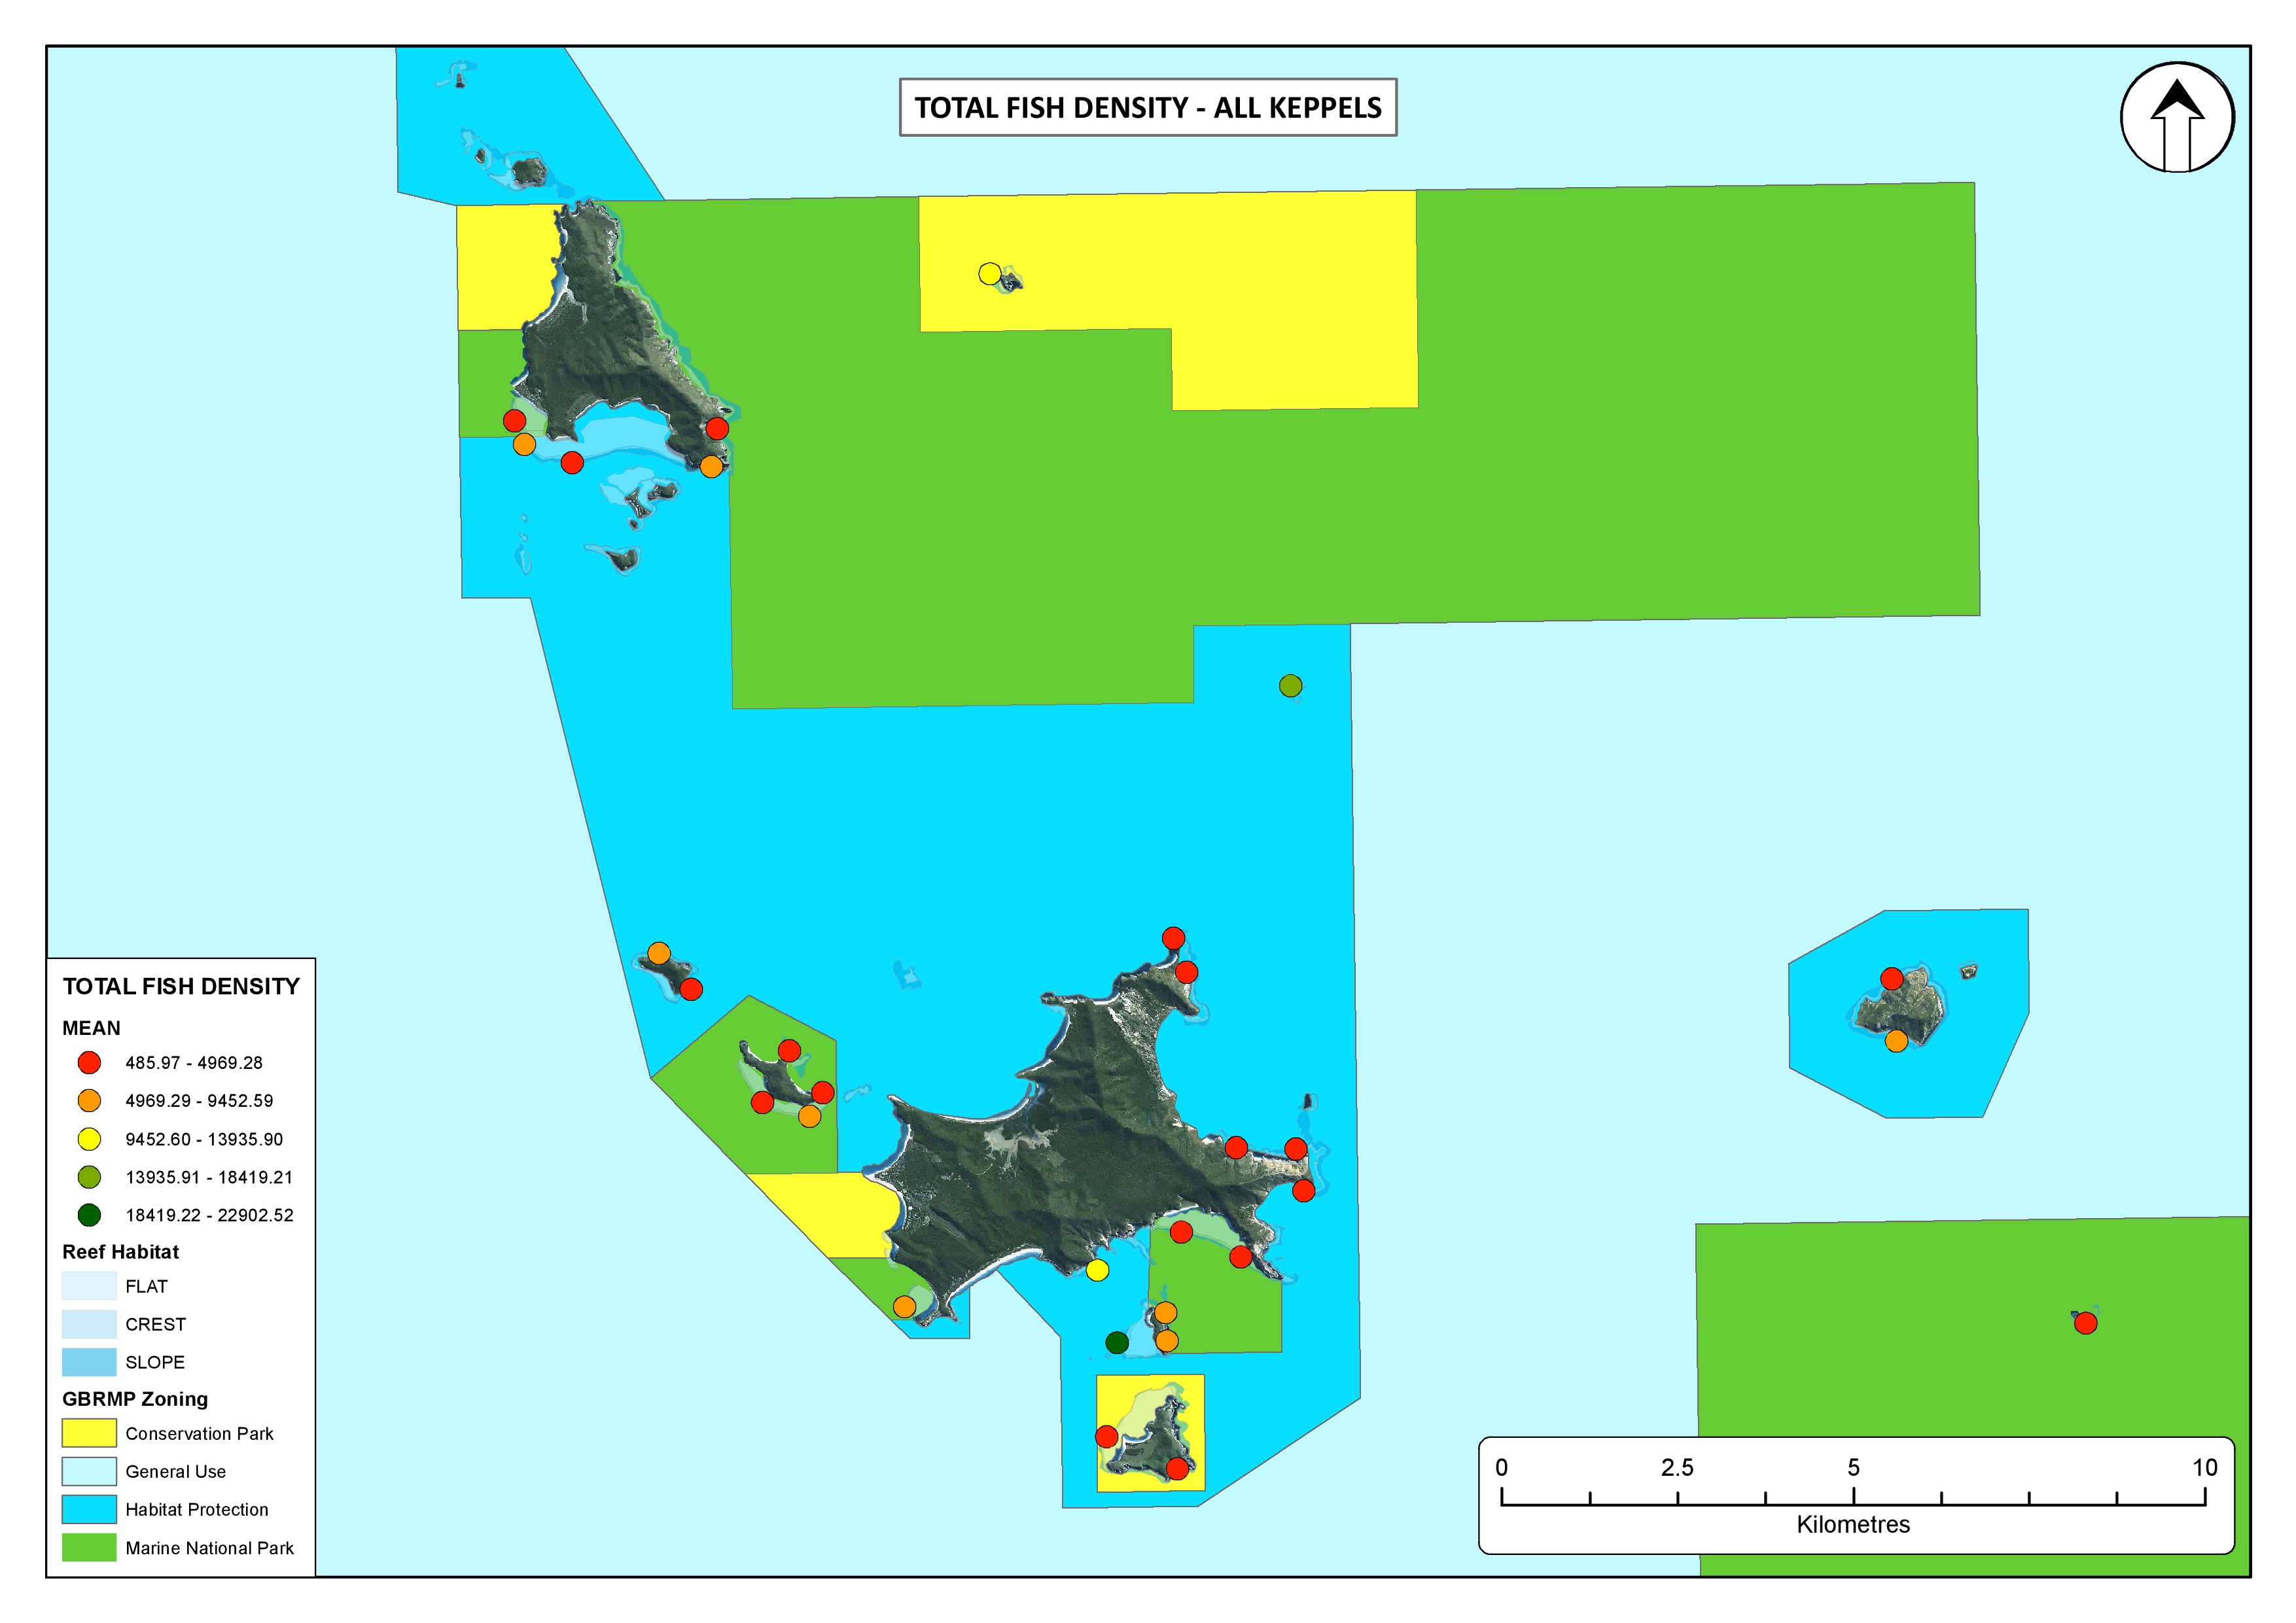
This dataset consists of site and zone means of the percent cover of major benthic categories and the density of fish functional groups on fringing coral reefs of the Keppel Island group, as a result of monitoring surveys carried out in 2015. This data extract summarises the results of the October 2015 survey of reef communities in the Keppel Island group. The data is a component of a long-term monitoring project that assesses the effects of no-take marine reserve zoning on inshore reefs of the Great Barrier Reef Marine Park. Spatial zoning for multiple-use is the cornerstone of management for the Great Barrier Reef Marine Park (GBRMP). Multiple-use zoning was first implemented widely in the GBRMP in the late 1980s and this original zoning plan was in place until 2004, when the marine park was completely rezoned under the Representative Areas Program (RAP). The overall proportion of the marine park area assigned into NTRs was increased from around 5% (~ 25% of the coral reefs) to 33.4%. The need to objectively assess the ecological consequences of zoning management has attracted an increasing amount of research effort in recent years. Critical knowledge gaps still remain however, and research is required to determine how and to what extent NTR networks may help to protect biodiversity, sustain stocks of fished species and increase ecosystem resilience. This monitoring project was established in 1999 and expanded in 2004, with the primary objective of providing a robust assessment of the ecological effects of multiple-use zoning on inshore coral reefs of the GBRMP. The project uses underwater visual census (UVC) to provide a spatially and temporally replicated assessment of fish and benthic communities and will include concurrent surveys of coral health within no-take (Green) and fished (Blue) zones on high-use inshore reefs. It is one of the few long-term monitoring projects specifically assessing the effects of zoning management within the GBRMP and the only one with a solid baseline data set that was established prior to the implementation of the 2004 zoning management plan. Methods: Underwater visual census (UVC) was used to survey reef fish and benthic communities on fringing coral reefs of the Keppel Island group during October 2015. Sites are evenly distributed between zones that have remained open to fishing (General Use and Conservation Park zones), NTRs that were closed to fishing in 1987, and NTRs that were established in 2004 (Marine National Park zones) (Figure 1). Within each site UVC surveys were conducted using 5 replicate transects (50m x 6m, 300m2 survey area). Transects were deployed on the reef slope between approximately 4 and 12 metres depth. Using SCUBA, two observers recorded approximately 190 species of fish from 15 Families (Acanthuridae, Balistidae, Chaetodontidae, Haemulidae, Labridae, Lethrinidae, Lutjanidae, Mullidae, Nemipteridae, Pomacanthidae, Pomacentridae, Scaridae, Serranidae, Siganidae and Zanclidae). A third diver (observer 3) swam directly behind observers one and two, deploying the transect tapes. This UVC technique reduces diver avoidance or attraction behaviour of the surveyed fish species. To increase accuracy of the fish counts, the species list was divided between the two fish observers. Observer one surveyed the fish families Haemulidae, Lethrinidae, Lutjanidae, Mullidae, Nemipteridae, Serranidae and the larger species of Labridae targeted by fishers. Observer two surveyed the families Acanthuridae, Balistidae, Chaetodontidae, Pomacanthidae, Pomacentridae, Scaridae, Siganidae, Zanclidae and small ‘non-targeted’ species of Labridae. Pomacentrids and small labrids were recorded by observer two during return transect swims within a 2m band (1m either side of the tape, 100m2 survey area). Broad-scale structural complexity of the reef habitat was estimated by observer one using a simple method that applied a rank (1-5) to both the angle of the reef slope and the rugosity for each ten-metre section of each transect. Observer three utilised a line intercept survey method to record a benthic point sample every metre along each transect tape (50 samples per transect).Benthos sampled in the benthic survey was live and dead hard coral within morphological categories (branching, plate, solitary, tabular, massive, foliose, encrusting) live soft coral, sponges, clams (Tridacna spp.), other invertebrates (such as ascidians and anemones), macro-algae, coral reef pavement, rock, rubble and sand. Format: The data are contained within three worksheets of an Excel file. All benthic data is in % cover, and fish data are in density (individuals per 1000m2). Sheet 1: Benthic and fish data averaged for each reef slope site Sheet 2: Benthic and fish data averaged for each reef flat site Sheet 3: Monitoring site coordinates References: 1. Lamb J.B., Wenger A.S., Devlin M.J., Ceccarelli D.M., Williamson D.H., Willis B.L. (in press). Reserves as tools for alleviating impacts of marine disease. Philosophical Transactions of the Royal Society B. DOI: 10.1098/rstb.2015.0210 2. Wen C.K.C., Bonin M.C., Harrison H.B., Williamson D.H., Jones G.P. (in press). Dietary shift in juvenile coral trout (Plectropomus maculatus) following coral reef degradation from a flood plume disturbance. Coral Reefs 3. Bonin M. C., Harrison H. B., Williamson D. H., Frisch A. J., Saenz-Agudelo P., Berumen M. L., Jones G.P. (2016). The role of marine reserves in the replenishment of a locally impacted population of anemonefish on the Great Barrier Reef. Molecular Ecology 25: 487–499. 4. Emslie M.J., Logan M., Williamson D.H., Ayling A., MacNeil M.A., Ceccarelli D.M., Cheal A.J., Evans R.D., Johns K.A., Jonker M.J., Miller I.R., Osborne K., Russ G.R., Sweatman H.P.A. (2015). Expectations and outcomes of reserve network performance following re-zoning of the Great Barrier Reef Marine Park. Current Biology 25: 983–992. 5. Hopf J.K., Williamson D.H., Jones G.P., Connolly S.R. (2015). Fishery consequences of marine reserves: short-term pain for longer-term gain. Ecological Applications 6. Lamb J.B., Williamson D.H., Russ G.R., Willis B.L. (2015). Protected areas mitigate diseases of reef-building corals by reducing damage from fishing. Ecology, 96(9): 2555–2567. 7. Wenger A.S., Williamson D.H., da Silva E.T., Ceccarelli D.M., Browne N., Petus C., Devlin M.J. (2015). The limitations of no-take marine reserves in protecting coral reefs from reduced water quality. Conservation Biology 30(1): 142 – 53. 8. Williamson D.H., Ceccarelli D.M., Evans R.D., Hill J.K., Russ G.R (2014). Derelict fishing line provides a useful proxy for estimating levels of non-compliance with no-take marine reserves. PLoS ONE 9(12): e114395. doi:10.1371/journal.pone.0114395 9. Williamson D.H., Ceccarelli D.M., Evans, R.D., Jones, G.P., Russ, G.R. (2014). Habitat dynamics, marine reserve status, and the decline and recovery of coral reef fish communities. Ecology & Evolution 4: 337-354. 10. Wen C.K., Almany G.R., Williamson D.H., Pratchett M.S., Mannering T.D., Evans R.D., Leis J.M., Srinivasan M., Jones G.P. (2013). Recruitment hotspots boost the effectiveness of no-take marine reserves. Biological Conservation 166: 124-131. 11. Wen C.K., Almany G.R., Williamson D.H., Pratchett M.S., Jones G.P. (2012). Evaluating the effects of marine reserves on diet, prey availability and prey selection by juvenile predatory fishes. Marine Ecology Progress Series 469: 133-144. 12. Harrison H.B., Williamson D.H., Evans R.D., Almany G.R., Thorrold S.R., Russ G.R., Feldheim K.A., van Herwerden L., Planes S., Srinivasan M., Berumen M.L., Jones G.P. (2012). Larval Export From Marine Reserves and the Recruitment Benefit for Fish and Fisheries. Current Biology 22: 1023-1028. 13. McCook L.J., Ayling A.M., Cappo M., Choat J.H., Evans R.D., De Freitas D.M., Heupel M., Hughes T.P., Jones G.P., Mapstone B., Marsh H., Mills M., Molloy F., Pitcher C.R., Pressey R.L., Russ G.R., Sutton S., Sweatman H., Tobin R., Wachenfeld D.R., Williamson D.H. (2010). Adaptive management of the Great Barrier Reef: A globally significant demonstration of the benefits of networks of marine reserves. Proceedings of the National Academy of Science (PNAS) 107: 18278-18285. 14. Diaz-Pulido G., McCook L.J., Dove S., Berkelmans R., Roff G., Kline D.I., Weeks S., Evans R., Williamson D.H., Hoegh-Guldberg O. (2009). Doom and Boom on a Resilient Reef: Climate Change, Algal Overgrowth and Coral Recovery. PLoS ONE 4: e5239. 15. Russ G.R., Cheal A.J., Dolman A.M., Emslie M.J., Evans R.D., Miller I., Sweatman H., Williamson D.H. (2008). Rapid increase in fish numbers follows creation of world's largest marine reserve network. Current Biology 18: 514-515. 16. Williamson D.H., Evans R.D., Russ G.R. (2006). Monitoring the ecological effects of management zoning: Initial surveys of reef fish and benthic communities on reefs in the Townsville and Cairns regions of the Great Barrier Reef Marine Park. Report to the Great Barrier Reef Marine Park Authority (GBRMPA) 67pp. Data Location: This dataset is saved in the eAtlas enduring data repository at: data\custodian\2015-2016-NESP-TWQ-1\2.1_Inshore-reef-refuges
-
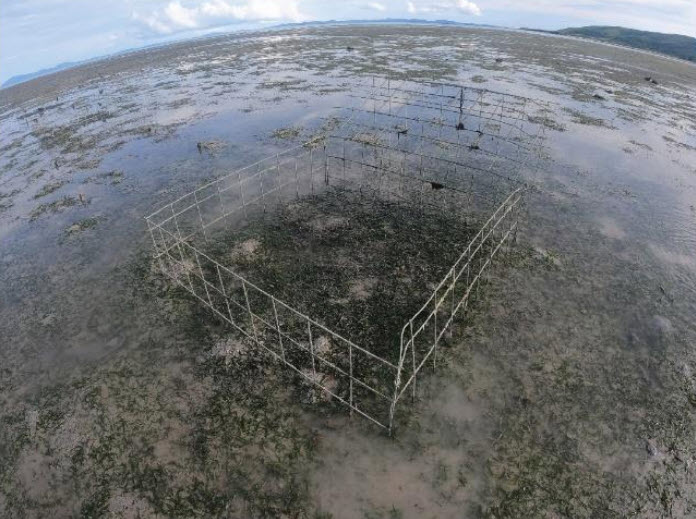
This record provides an overview of the NESP Marine and Coastal Hub small-scale study - "The role of dugong and turtle grazing in Torres Strait seagrass declines". For specific data outputs from this project, please see child records associated with this metadata. Dramatic declines in seagrass meadows in the Torres Strait Western Cluster were recorded in 2019 and 2020. These meadows are culturally important and represent significant foraging grounds for green turtles and dugongs. This project will use a short-term field study to investigate the role of megaherbivore grazing in two key locations where seagrass declines have been most dramatic. This project has been co-developed with the TSRA, Sea Rangers and Goemulgaw PBC in response to community concerns about seagrass declines and the implications for the totemic megaherbivores they support. The results will inform Traditional Owner led dugong and turtle management plans and help direct actions for remediation as required. Outputs • Field experiment assessing the whether reductions in seagrass cover at Mabuyag and Orman Reefs is due to grazing from Turtles and Dugongs. The experiment consists of cages over patches of seagrass that exclude grazers. The seagrass canopy and biomass is then compared with control patches [spreadsheet data]. • Final technical report with analysed data and a short summary of recommendations for policy makers of key findings [written]
-

This record provides an overview of the NESP Marine and Coastal Hub small-scale study - NESP MaC Project 1.29 a: Great Reef Census - a case study to integrate citizen science data into research output for marine habitat management". For specific data outputs from this project, please see child records associated with this metadata. To maximise our understanding of our marine and coastal environment, we need to take advantage of emerging technologies and approaches. This includes citizen science, community monitoring and Indigenous Rangers. Technology has greatly reduced the gap between mainstream science and community science to the point they may become almost identical in some integrated programs, especially when involving collection of in-field information. The challenge for science is to integrate with the vast opportunities afforded by this congruence. The Great Reef Census (GRC) is an established citizen science innovation project, designed to pilot new ways of capturing reconnaissance citizen science data. By using citizen scientists to both collect and analyse reef images, as well as a team of professional scientists to ensure program rigour, the project is an innovative approach to assessing Great Barrier Reef health that complements and enhance existing monitoring programs. The aim of this project is to demonstrate a citizen science approach can effectively fill gaps in knowledge when assessing marine habitats to improve management outcomes. As a case study, it will demonstrate how citizen science data can be integrated into the monitoring programs across Australia’s marine and coastal environments using new digital technology platforms. The project will also complement ongoing GBR-based research and provide critical knowledge gaps through end-user engagement with GBRMPA’s CoTS Control Program and Australia’s reporting on the health of the GBR. Our study will 1) scrutinise, validate and synthesize expert versus citizen scientist analyses of geo-referenced images collected during the Great Reef Census Year 1 field campaign and using the analysis platform, and 2) explore a re-structured online analysis platform that integrates machine learning and citizen science to extract more output from a growing image library collected during field efforts. The end product will provide a case-study evaluation of the benefits and capability of citizen-science programs as well as assisting decision-making capacity based on real-time broad spatial scale information on the Great Barrier Reef. The output will provide a demonstrated case study of meaningful citizen science application to assess marine habitats which can be applied more broadly to tropical marine habitats. Planned Outputs • Synthesis R data package • Final technical report with analysed data and a short summary of recommendations for policy makers of key findings [written]
-

This record provides an overview of the NESP Marine and Coastal Hub small-scale study - Project 3.2 - Developing a National Indigenous Environmental Research Network – Marine and Coastal research case studies. For specific data outputs from this project, please see child records associated with this metadata. The proposed National Indigenous Environmental Research Network (NIERN) is an Indigenous-led strategic initiative to establish a community of practice that supports current environmental research needs and priorities, enhance future research agendas, mobilise investment opportunities, bolster the impact and durability of research outcomes and empower Indigenous Australians to participate in the national environmental scientific research agenda. This project will experiment with conceptual models for establishing a working NIERN to provide evidence that will guide Indigenous organisations, policy makers and researchers that aim to support Indigenous leadership and participation in environmental research. The NESP 2020 review reported that “Indigenous peoples seek earlier involvement in land and sea country research. This means being formally included in the project design, development and delivery.” The project team will work with Indigenous organisations, government agencies and researchers across Australia to provide a national perspective of current processes used to establish new research priorities and projects and use case studies to explore how Indigenous led approaches could augment these projects through Indigenous participation at all project stages. Planned Outputs • Mapping dataset [spatial dataset] • Final technical report with analysed data and a short summary of recommendations for policy makers of key findings [written]
-

This record provides an overview of the NESP Marine and Coastal Hub small scale scoping study: Marine and Coastal Threatened Species and Communities. There are numerous species and ecological communities in Australia’s marine and coastal environments that have formal threatened conservation status. Through a process of targeted reviews, expert elicitation and workshops with end-users, domain experts and others, this project will identify and co-design prospective research projects that best deliver information that will notably improve the status of key selected threatened species in Australia’s marine and coastal environment. Outputs will include summaries of workshops outcomes and a set of co-designed research proposals for submission in future Hub annual research plans. This project also provides the platform for MAC Hub contributions to the Resilient Landscapes Hub Cross-Hub Mission Project 7.0 on Threatened and Migratory Species and Ecological Communities. Planned Outputs • Final technical report recommendations for policy makers of key findings for priority research areas [written]
-

This record provides an overview of the NESP Marine and Coastal Hub small-scale study - Defining a pathway for the operational use of emerging technologies on country. Marine and coastal impacts in northern Australia occur overwhelmingly on Indigenous managed land. However, the collection, analysis and use of data to support adaptive management of the threats to these important ecosystems is dominated by external organisations. Existing monitoring solutions rely on trust in the training and expertise of the people collecting the data. The appropriate use of technology and associated training for Indigenous practitioners, coupled with software and hardware development, offers an alternative for Indigenous organisations and funders to deliver environmental, social and cultural impacts in northern Australia. NAILSMA and its partners have been engaged in activities that seek to develop ethical and inclusive technology solutions that enable Indigenous organisations new opportunities to maximize the participation and leadership in activities that support the management of threats to ecosystems across northern Australia. Planned Outputs • Final technical report with analysed data and a short summary of recommendations for policy makers of key findings [written]
-
This record provides an overview of the NESP Marine and Coastal Hub small-scale study - "Regional planning in northern Australia: Building a community of practice and sentinel case studies for supporting improved approaches to achieve ESD". This project grows momentum from NESP MAC Hub Project 1.32, which engaged northern Australians on the need for improved regional planning to deliver Ecologically Sustainable Development (ESD) outcomes. Project 1.32 identified Stage 2 investment to build: (i) a strong regional planning community of practice across the north; and (ii) three longer-standing sentinel case studies for improving regional planning practice within northern regions (WA, NT and Qld). In a methodological sense, the northern Australian community of practice will build on the network foundations established in Project 1.32, and will focus on scanning best practice approaches across the north, exploring innovative ways to communicate these approaches, and ensuring the network is strengthened through regular newsletters and targeted symposiums. The sentinel case study approach will inform policy and practice improvement at the jurisdictional and Commonwealth scales, and will apply Governance Systems Analysis approaches developed under previous NERP and NESP investments. This innovative method employs highly deliberative and evidence-based approaches to the practical analysis of complex governance systems in highly contested landscapes like northern Australia. Given the emerging Commonwealth focus on regional planning effort based on the Samuel review, this project represents perfect timing to focus on best practice, including knowledge management, as well as the opportunity to support emerging Commonwealth, State and Territory efforts regarding these reforms. It particularly addresses the headline issue identified in the MaC Hub 2023 Research Plan which seeks to “address the governance requirements and barriers for regional planning nationally”. This particularly includes an emphasis on northern Australia (i.e. de-risking landscapes). Planned Outputs • Case Study Governance Analysis [dataset] • Final technical report with analysed data and a short summary of recommendations for policy makers of key findings [written]
-
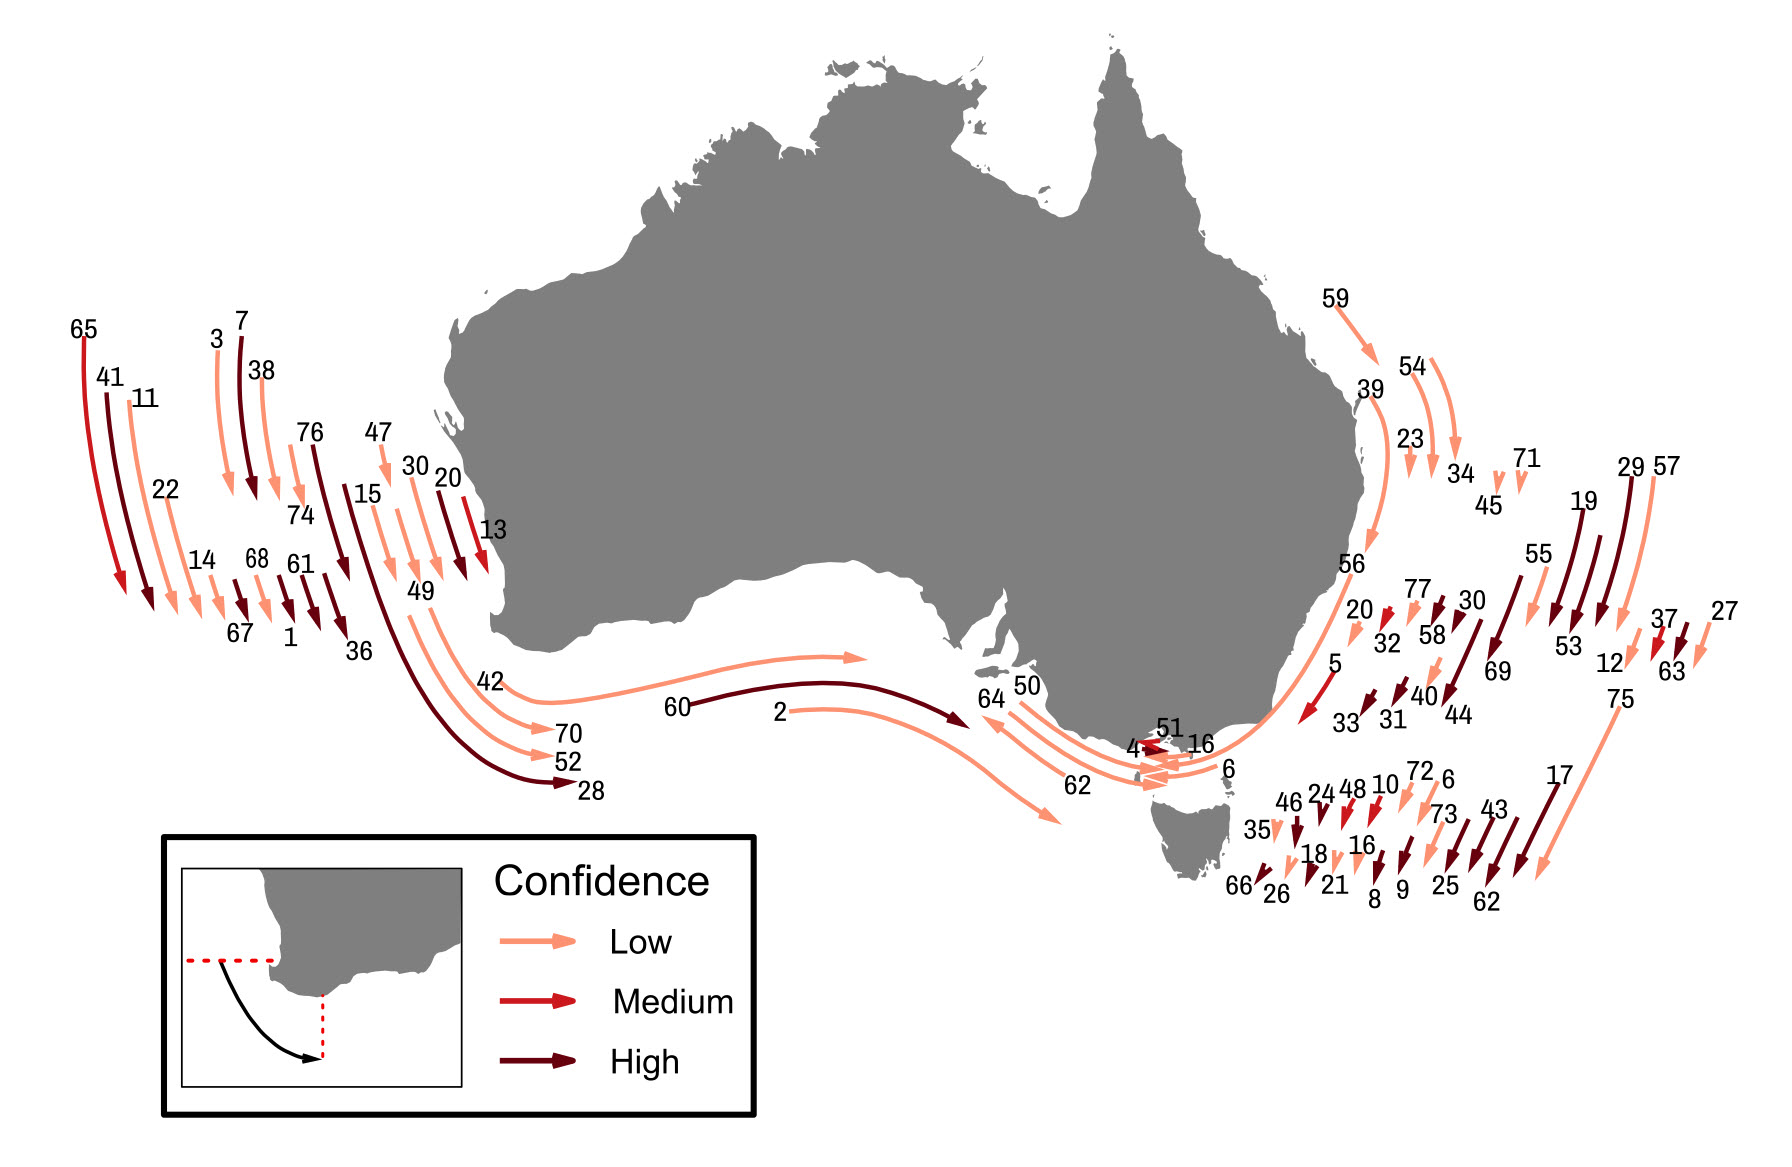
This dataset consists of the historical range limits and poleward-most extent of recent extralimital occurrence of 82 potential marine species’ range extensions around Australia (NSW, QLD, SA, TAS, VIC and WA) revealed by an assessment of citizen scientists observations from Redmap, Reef Life Survey, and iNaturalist from 2013–2022. The purpose of this project was to assess evidence for climate-driven marine species range extensions with data provided by Australian citizen scientists. While there are at least 198 documented range shifts of marine species in the scientific literature, there are large gaps in our ability to formally monitor changes in species distributions both geographically and across taxonomic groups that citizen scientists (beachcombers, divers, fishers, snorkelers, etc.) can help resolve. This assessment had two main components: Establish historical poleward range limits for each of 200 target species tracked by Redmap (up to the year 2012); and assess the evidence for extralimital occurrence of each species in the subsequent decade across three citizen science databases (Redmap, Reef Life Survey, iNaturalist). Confidence of species range extension occurring was qualitatively estimated (high, medium, or low) based on species traits (e.g., mobility, detectability) and strength of evidence provided by citizen science data (e.g., evidence of overwintering, multi-year detections). These results provide an early indication of species and regions where more focused monitoring or research effort may be warranted. These findings were developed into report cards for dissemination to both demonstrate the value of citizen science and engage with the public on climate change and marine biodiversity, using their own information. Methods: This assessment had two main components: 1) Establish historical poleward range limits up to the year 2012 for each of 200 target species; and 2) assess the evidence for extralimital occurrence of each species in the subsequent decade across three citizen science databases (Redmap, Reef Life Survey, iNaturalist). Confidence of species range extension occurring was qualitatively estimated (high, medium, or low) based on species traits (e.g., mobility, detectability) and strength of evidence provided by citizen science data (e.g., evidence of overwintering, multi-year detections). These methods were a modified version of the Robinson et al. (2015) framework developed through a workshop process in November 2021. The assessment target species list consisted mainly of species on the Redmap (Range Extension Database and Mapping project) target list and a select opportunistic additions, totalling 200 species. Species historical poleward range limits were established up to the year 2012 from both distributional references such as Australian Faunal Directory (AFD, ABRS 2009) and Australian National Expert Fish Distributions (https://researchdata.edu.au/australian-national-fish-expert-distributions/671428) and a review of available raw occurrence data (Atlas of Living Australia, pre-2013 citizen science observations of target species, etc.) to document the poleward-most known occurrences of each target species. Species for which there was uncertainty regarding taxonomy or historical distribution limits that would have a bearing on assessment results were excluded from the assessment. A 20 km buffer was added on to range limits to reduce artifact from range limits established to low precision. Citizen science observations of target species up to February 2022 were accessed from iNaturalist Australasian Fishes project, Redmap, and Reef Life Survey (via the Australian Ocean Data Network). iNaturalist records underwent additional verification by species experts, and as Reef Life Survey data does not formally have photographic evidence associated with it, these data were only used in a corroboratory role for species for which extralimital observations from the other citizen science databases were available. Confidence of potential range extensions evidence by extralimital observations was estimated qualitatively based on detections across multiple years and for non-highly-mobile species, evidence of overwintering (during the coldest months of the year on either coast). Detectability, due to rarity, small size and/or cryptic colouration/behaviour was also taken into consideration. To summarise the extent of each assessed range extension, the assessed historical range limit and the most out-of-range observation were identified for each species and collated in this data set. Locations represent latitudes, or on the south coast, longitudes. Limitations of the data: These data only represent the latitudes (or longitudes on the south coast) of species range limits (as of 2012) and recent extralimital observations rather than precise coordinates. These results only reflect the assessment of 200 target species and not an exhaustive list of marine species range extensions to the present or those reflected in the citizen science databases. Not all assessed extralimital observations indicate a species is undergoing a geographical range extension (see confidence estimates) Format of the data: The dataset consists of a table with 82 instances of potential marine species range extensions noted by the latitude (or longitude, on the south coast) of historical range limits and extent of recent observations. Data dictionary: - #: Corresponds to alphabetical ordered species, and the numbers on the preview map. - Species name: Species scientific name. - State: state(s) along which potential range extension occurred (to distinguish disparate extensions of the same species, e.g. on both east and west coasts). - Confidence in range extension: qualitative estimate that out-of-range observations represent an ongoing range extension produced by the assessment. - Historical distribution limit: latitude (or longitude on the south coast) of the species’ poleward known distributional limit as of 2012. - New extent: latitude (or longitude on the south coast) of new poleward-most extent provided by citizen science observations of the species from 2013-2022. - Distance (km): latitudinal (or longitudinal, insofar as inferred to be occurring along the south coast) distance between historical distribution limit and new extent, in kilometres. - Notes: “adults” indicates range extensions of adult life stages only (i.e., into areas where juveniles were previously known to occur). eAtlas Processing: The original data were provided as a csv file with a png map and preview image (jpg). No modifications to the underlying data were performed and the data package are provided as submitted. Location of the data: This dataset is filed in the eAtlas enduring data repository at: data\\custodian\2021-2022-NESP-MaC-1\1.30_Climate-driven-species-redistribution
-

This record provides an overview of the NESP Marine and Coastal Hub small-scale study - NESP Marine and Coastal Hub scoping study: New approaches to monitoring. Observations of marine species have rapidly diversified over the last decade with increasing numbers of observations collected either through citizen science programs or opportunistically by citizens and then submitted into public databases. The expectation of citizens contributing those data is that the data is incorporated into formal analyses and utilised either for scientific or management purposes, with outcomes that improve current understanding and conservation of marine species. Further, there is increasing reliance on more informal and publicly driven approaches to the collection of observations given the costs of conducting formal surveys particularly if accessing remote regions, or if repetition of collection (across seasons or years) is needed. Integrating opportunistic observations with more formally collected observations (e.g. those collected through robust survey designs), however, is not straightforward. Traditional approaches to estimating population abundance, changes in species assemblages, abundances and distributions through time require some understanding of the effort associated with those observations and how that effort is also distributed through time; information that is missing from opportunistic observations, given the nature of those observations. Further, many opportunistically collected datasets do not meet the statistical assumptions of many analytical approaches that might be applied to scientific datasets. As a result, opportunistic observations are underutilised at present and are largely only used qualitatively within research applications. To take full advantage of this rapidly expanding resource and ensure that efforts associated with the collection of these observations are not wasted, methods that can integrate opportunistically collected data with scientific datasets are needed. This project represents the first stage in developing integrative methods. It will bring together data holders, quantitative ecologists and statisticians to explore potential approaches that might be applied to facilitate the integration of opportunistic datasets with scientific datasets. In doing so, it will identify what datasets might be best suited to the development of integrative approaches (and what might not) and outline a pathway for developing those methods that could be implemented through a future project Planned Outputs • Workshop • Final technical report with analysed data and a short summary of recommendations for policy makers of key findings [written]
-
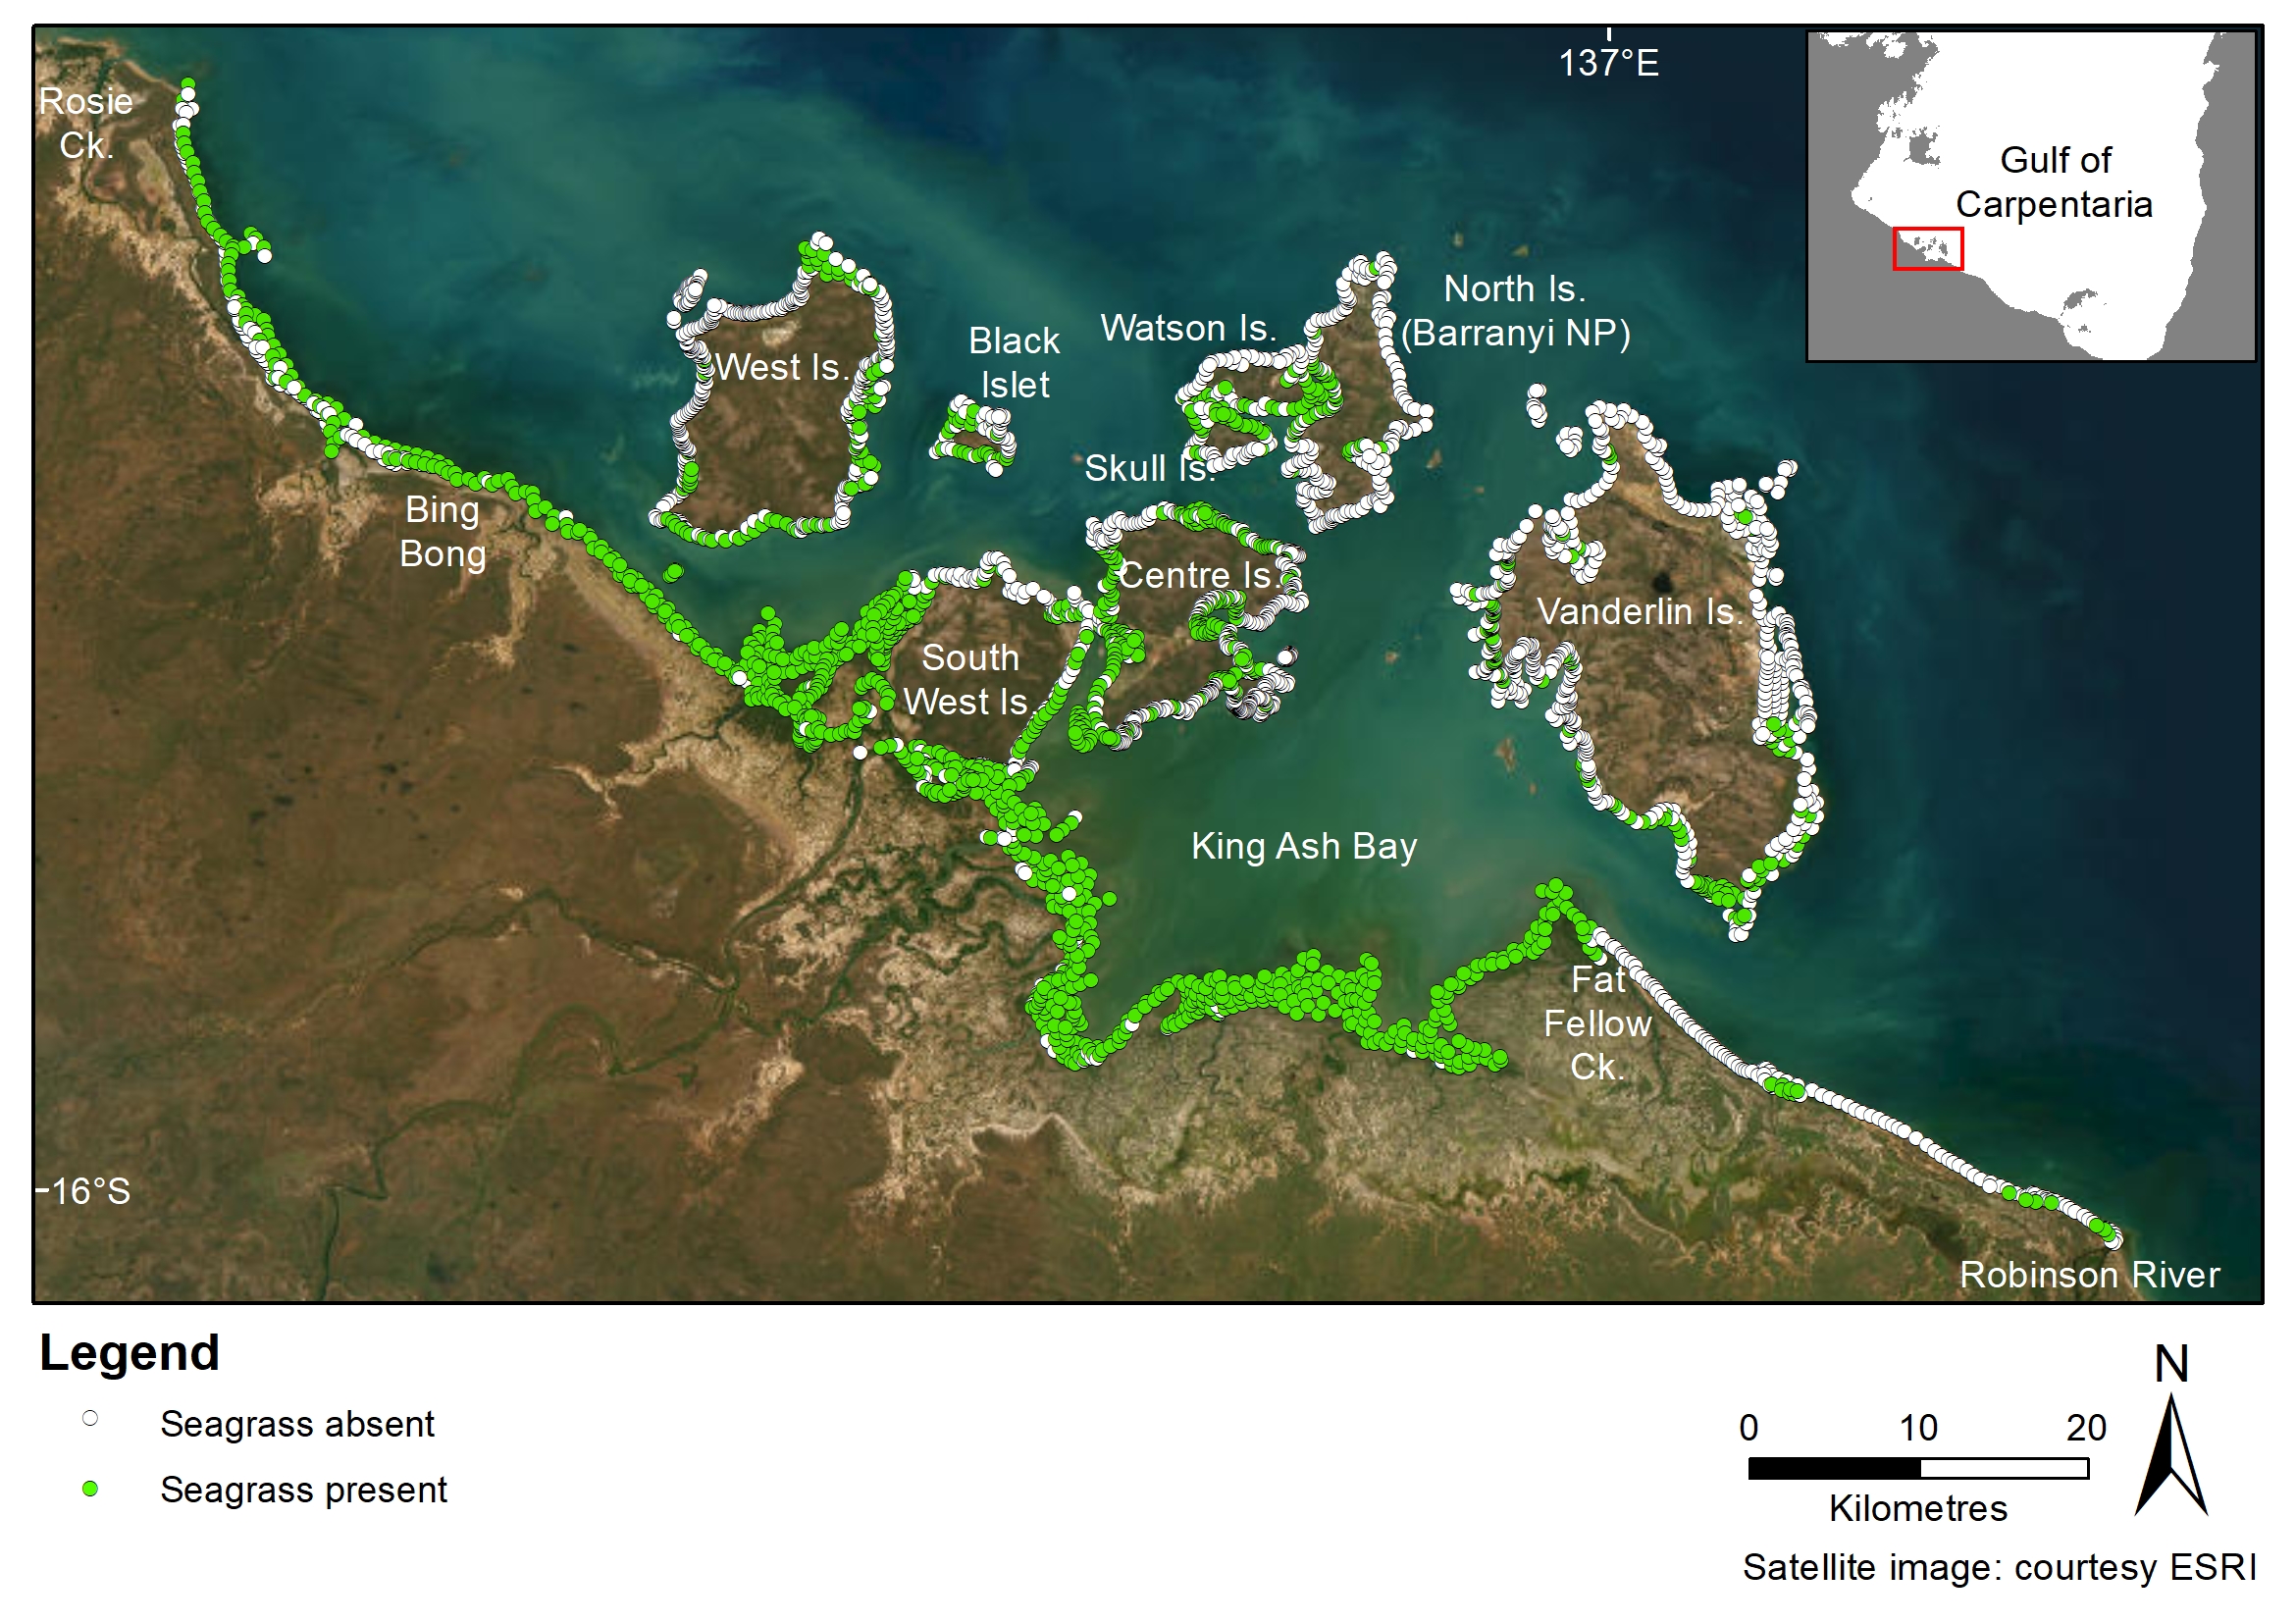
This dataset summarises benthic surveys in Yanyuwa Sea Country into 3 GIS shapefiles. (1) A point (site) shapefile describes seagrass presence/absence at 3248 sites surveyed by small vessel and helicopter. (2) The meadow shapefile describes attributes of 180 intertidal seagrass meadows. (3) The interpolation GeoTiff describes variation in seagrass biomass across the seagrass meadows. This project is a partnership between li-Anthawirriyarra rangers, Charles Darwin University, James Cook University, and Mabunji Aboriginal Resource Indigenous Corporation to map the intertidal habitats of the Yanyuwa Indigenous Protected Area (IPA), an area of profound importance to the Marra and Yanyuwa people and to the marine ecosystem of the Gulf of Carpentaria. Benthic habitat maps of Yanyuwa Country were produced, with a focus on seagrass. Report reference: Groom R, Carter A, Collier C, Firby L, Evans S, Barrett S, Hoffmann L, van de Wetering C, Shepherd L, Evans S, Anderson S. (2023) Mapping Critical Habitat in Yanyuwa Sea Country. Report to the National Environmental Science Program. Charles Darwin University, pp. 40. Available at: https://www.nespmarinecoastal.edu.au/wp-content/uploads/2023/07/NESP-MaC-Hub-Project-1.12_Groom-et-al-FINAL-REPORT.pdf Methods: The sampling methods used to study, describe and monitor seagrass meadows were developed by the TropWATER Seagrass Group and tailored to the location and habitat surveyed; these are described in detail in the relevant publications (https://research.jcu.edu.au/tropwater). Geographic Information System (GIS) All survey data were entered into a Geographic Information System (GIS) developed for Torres Strait using ArcGIS 10.8. Rectified colour satellite imagery of Yanyuwa Sea Country (Source: Allen Coral Atlas and ESRI), field notes and aerial photographs taken from the helicopter during surveys were used to identify geographical features, such as reef tops, channels and deep-water drop-offs, to assist in determining seagrass meadow boundaries. Three GIS layers were created to describe spatial features of the region: a site layer, seagrass meadow layer, and a seagrass biomass interpolation layer. Seagrass site layer This layer contains information on data collected at assessment sites. This layer includes: 1. Temporal survey details – Survey date; 2. Spatial position - Latitude/longitude; 3. Survey location; 4. Seagrass information including presence/absence of seagrass, above-ground biomass (total and for each species), percent cover of seagrass at each site and whether individual species were present/absent at a site; 5. Benthic macro-invertebrate information including the percent cover of hard coral, soft coral, sponges and other benthic macro invertebrates (e.g. ascidian, clam) at a site; 6. Algae information including percent cover of algae at a site and percent contribution of algae functional groups to algae cover at a site; 7. Open substrate – the percent cover of the site that had no flora or habitat forming benthic invertebrates present; 8. Dominant sediment type - Sediment type based on grain size visual assessment or deck descriptions. 9. Survey method and vessel 10. Relevant comments and presence/absence of megafauna and animals of interest (dugong, turtle, dolphin, evidence of dugong feeding trails); 11. Data custodians. Seagrass meadow layer Seagrass presence/absence site data, mapping sites, field notes, and satellite imagery were used to construct meadow boundaries in ArcGIS®. The meadow (polygon) layer provides summary information for all sites within each seagrass meadow, including: 1. Temporal survey details – Survey month and year as individual columns and the survey date (the date range the survey took place); 2. Spatial survey details – Survey location, meadow identification number that identifies the reef name and the meadow number. This allows individual meadows to be compared among years; 3. Survey method; 4. Meadow depth for subtidal meadows. Intertidal: meadow was mapped on an exposed bank during low tide; 5. Species presence – a list of the seagrass species in the meadow; 6. Meadow density – Seagrass meadows were classified as light, moderate, dense based on the mean biomass of the dominant species within the meadow. For example, a Thalassia hemprichii dominated meadow would be classed as “light” if the mean meadow biomass was <5 grams dry weight m-2 (g DW m-2), and “dense” if mean meadow biomass was >25 g DW m-2. 7. Meadow community type – Seagrass meadows were classified into community types according to seagrass species composition within each meadow. Species composition was based on the percent each species’ biomass contributed to mean meadow biomass. A standard nomenclature system was used to categorize each meadow. 8. Mean meadow biomass measured in g DW m-2 (+ standard error if available); 9. Meadow area (hectares; ha) (+ mapping precision) of each meadow was calculated in the GDA 2020 Geoscience Australia MGA Zone 53 projection using the ‘calculate geometry’ function in ArcMap. Mapping precision estimates (R; in ha) were based on the mapping method used for that meadow. Mapping precision estimate was used to calculate an error buffer around each meadow; the area of this buffer is expressed as a meadow reliability estimate (R) in hectares; 10. Any relevant comments; 11. Data custodians. Seagrass biomass interpolation layer An inverse distance weighted (IDW) interpolation was applied to seagrass site data to describe spatial variation in seagrass biomass within seagrass meadows. The interpolation was conducted in ArcMap 10.8. Base map The base map used is courtesy ESRI 2023. Format of the data: This dataset consists of 1 point layer package, 1 polygon layer package and 1 raster file: 1. Yanyuwa Sea Country sites 2021-2022.lpk - Symbology representing seagrass presence/absence at each survey site 2. Yanyuwa Sea Country seagrass meadows 2021-2022.lpk - Symbology representing dominant species (in terms of biomass) for each intertidal meadow. 3. Yanyuwa Sea Country seagrass biomass interpolation 2021-2022.lpk - Symbology representing the spatial variation in seagrass biomass within each seagrass meadow. Data dictionary: Yanyuwa Sea Country sites 2021-2022 (point data) SITE (text) - Unique identifier representing a single sample site MEADOW (text) - Unique identifier representing what meadow the sample site is located in. Blank if sample site is not located within a meadow SURVEY_DATE (numeric) – survey date (day/month/year) MONTH (text) – survey month YEAR (numeric) – survey year SURVEY_NAME (text) – Name of survey location LOCATION (text) – Name of survey location LATITUDE (numeric) – Site location in decimal degrees south LONGITUDE (numeric) – Site location in decimal degrees east TIME (numeric) – sample time (24 hours; GMT +9:30) (NT time - subtidal sites only) DEPTH (numeric) – depth recorded from vessel depth sounder (metres) for subtidal sites. Intertidal sites depth recorded as 0. DBMSL (numeric) – depth below mean sea level (metres) for subtidal sites. Intertidal sites depth recorded as 0. TIDAL (text) – identifying if the site was in an intertidal or subtidal location SUBSTRATE (text) – tags identifying the types of substrates at the sample site. Possible tags are Mud, Sand, Coarse Sand, Silt, Shell, Rock, Reef, Rubble and various combinations. Listed in order from most dominant substrate to least dominant. SEAGRASS_P (numeric) – Absence (0) or Presence (1) of seagrass SEAGRASS_C (numeric) - Estimated % of seagrass cover at sample site SEAGRASS_B (numeric) - Estimated total biomass per square metre for sample site calculated from the mean of three replicate quadrats. Unit is gdw m-2. SEAGRASS_SE (numeric) – standard error of biomass at sample site calculated from the three replicate quadrats used to estimate biomass at a sample site. Unit is gdw m-2. EXCLUDE_B (numeric) – Include (0) or Exclude (1). Any site identified that needs to be excluded from contributing to the calculation of mean meadow biomass, e.g. where a visual estimate of biomass could not be optioned (i.e. no visibility at the site, only a van Veen sediment grab was used at the site) C. rotundata (numeric) – Estimated biomass of Cymodocea rotundata at the sample site. Unit is gdw m-2. C. serrulata (numeric) – Estimated biomass of Cymodocea serrulata at the sample site. Unit is gdw m-2. E. acoroides (numeric) – Estimated biomass of Enhalus acoroides at the sample site. Unit is gdw m-2. H. uninervis (narrow) (numeric) – Estimated biomass of Halodule uninervis (narrow leaf morphology) at the sample site. Unit is gdw m-2. H. uninervis (wide) (numeric) – Estimated biomass of Halodule uninervis (wide leaf morphology) at the sample site. Unit is gdw m-2. H. decipiens (numeric) – Estimated biomass of Halophila decipiens at the sample site. Unit is gdw m-2. H. ovalis (numeric) – Estimated biomass of Halophila ovalis at the sample site. Unit is gdw m-2. H. spinulosa (numeric) – Estimated biomass of Halophila spinulosa at the sample site. Unit is gdw m-2. H. tricostata (numeric) – Estimated biomass of Halophila tricostata at the sample site. Unit is gdw m-2. S. isoetifolium (numeric) – Estimated biomass of Syringodium isoetifolium at the sample site. Unit is gdw m-2. T. ciliatum (numeric) – Estimated biomass of Thalassodendron ciliatum at the sample site. Unit is gdw m-2. T. hemprichii (numeric) – Estimated biomass of Thalassia hemprichii at the Z. muelleri (numeric) – Estimated biomass of Zostera muelleri at the sample site. Unit is gdw m-2. ALGAE_COVER (numeric) - Estimated % of algae cover at sample site (all algae types grouped) TURF_MAT (numeric) – (Turf mat algae % contribution to algae cover). Algae that forms a dense mat on the substrate ERECT_MACROPHYTE (numeric) – (Erect macrophyte algae % contribution to algae cover). Macrophytic algae with an erect growth form and high level of cellular differentiation, e.g. Sargassum, Caulerpa and Galaxaura species ENCRUSTING (numeric) – (Encrusting algae % contribution to algae cover). Algae that grows in sheet-like form attached to the substrate or benthos, e.g. coralline algae. ERECT_CALCAREOUS (numeric) – (Erect calcareous algae % contribution to algae cover). Algae with erect growth form and high level of cellular differentiation containing calcified segments, e.g. Halimeda species. FILAMENTOUS (numeric) – (Filamentous algae % contribution to algae cover). Thin, thread-like algae with little cellular differentiation. *Note: TURF_MAT + ERECT_MACROPHYTE + ENCRUSTING + ERECT_CALCAREOUS + FILAMENTOUS = 100% of algae cover HARD_CORAL (numeric) – (Hard coral %). All scleractinian corals including massive, branching, tabular, digitate and mushroom SOFT_CORAL (numeric) – (Soft coral %). All alcyonarian corals, i.e. corals lacking a hard limestone skeleton SPONGE (numeric) – (Sponge %) OTHER_BMI (numeric) – Any other benthic macro-invertebrates identified, e.g. oysters, ascidians, clams. Other benthic macro-invertebrates are listed in the “comments” attribute for intertidal and shallow subtidal camera drops, and listed as percent cover in the deepwater GIS. OPEN_SUBSTRATE (numeric) – Open substrate, no seagrass, algae or benthic macro-invertebrates at site DUGONG (numeric) - Absence (0) or Presence (1) of dugong/s at site TURTLE (numeric) - Absence (0) or Presence (1) of turtle/s at site DOLPHIN (numeric) - Absence (0) or Presence (1) of dolphin/s at site DFT PRESENT (numeric) - Absence (0) or Presence (1) of dugong feeding trails at site. Only clearly visible and therefore assessed at intertidal sites. Subtidal sites not assessed for DFTs coded as -999 METHOD (text) – e.g. helicopter, walking, hovercraft, boat-based including camera, free diving, scuba diving, van Veen grab, sled net VESSEL (text) – Vessel name (if known) COMMENTS (text) – Any comments for that site CUSTODIAN (text) – Custodian/owner of the data set UPDATED (text) - The date the shapefile was last updated AUTHOR (text) – Creator of GIS from the data set *Note: SEAGRASS_C + ALGAE_COVER + HARD_CORAL + SOFT_CORAL + SPONGE + OTHER_BMI + OPEN_SUBSTRATE = 100% of benthic cover Yanyuwa Sea Country seagrass meadows 2021-2022 (polygon data) ID (numeric) - Unique identifier representing a single meadow SURVEY_NAME (text) – Name of survey location LOCATION (text) – Name of survey location SURVEY_DATE (text) – Sample date (day/month/year) MONTH (numeric) – Sample month YEAR (numeric) – Sample year PERSISTENCE (text) – Meadow form on three categories: enduring, transitory, unknown DENSITY (text) – Meadow density categories (light, moderate, dense) TYPE (text) - Meadow community type determined according to seagrass species composition within the meadow SPECIES (text) – (Seagrass species): seagrass species found within the meadow. Species are recorded as abbreviated species names such as “E. acoroides” TOT_SITES (numeric) – (Number of survey sites): the number of sample sites within the meadow BIOMASS (numeric) – (Seagrass biomass (gdw m-2)): Mean biomass calculated from all sites (BIO_SITES) within an individual meadow SE (numeric) – (Standard Error (gdw m-2)): The error is a calculation of standard error of biomass from all (BIO_SITES) sites within an individual meadow. Where only 1 site surveyed in the meadow, SE will be 0. Where two sites were surveyed and biomass was 0 at one site, mean biomass and SE are the same values when calculated; AREA_HA (numeric) – (Meadow area (Ha)): Estimated meadow size (unit: hectares) R_M (numeric) – (Meadow mapping precision (m)): Estimated mapping precision based on mapping method. R_HA (numeric) - (Meadow reliability estimate (Ha)): Meadow reliability estimate (unit: hectares). Expressing the error buffer around each meadow as calculated from the mapping precision estimate SURVEY METHOD (text) – e.g. helicopter, walking, hovercraft, boat-based including camera, free diving, scuba diving, van Veen grab, sled net VESSEL (text) – Vessel name (if known) COMMENTS (text) – Any relevant comments for that meadow UPDATED (date) – The date the shapefile was last updated CUSTODIAN (text) – Custodian/owner of the data set AUTHOR (text) – Creator of GIS from the data set Yanyuwa biomass interpolation 2022 (interpolation layer) Inverse Distance Weighted interpolation. Band 1: Interpolated biomass in gdw m-2 Data Description: This section provides an brief text description of the data. This data set shows that in Yanyuwa sea country in the Gulf of Carpentaria, that there is significant seagrass along the coastline. The inshore coastline seagrass continues from Rosie Creek to Robinson River, where King Ash Bay and Bing Bong has almost continuous, reasonably dense seagrass meadows. Seagrass cover is present around the north, east and southern intertidal areas of West Island. Around the northern side of Black Islet has seagrass as well as north areas of Skull Island. Watson Island has seagrass areas on the southern and eastern coastlines. Seagrass cover can be found on Centre Island on all sides, particularly on the east and western sides. Vanderlin Island has light seagrass cover mostly towards the southern tip. Species present in these regions include C. serrulate, E. acoroides, H. ovalis, H. uninervis. eAtlas Processing: The original data were provided as ArcGIS Layer Packages (lpk]. Data were converted to Shapefiles and GeoTiff with no modifications to the underlying data. Location of the data: This dataset is filed in the eAtlas enduring data repository at: data\\custodian\NESP-MaC-1\1.12_Yanyuwa-sea-country-seagrass