 eAtlas Data Catalogue
biota
Type of resources
Topics
Keywords
Contact for the resource
Provided by
Years
Formats
Representation types
Update frequencies
status
Scale
-
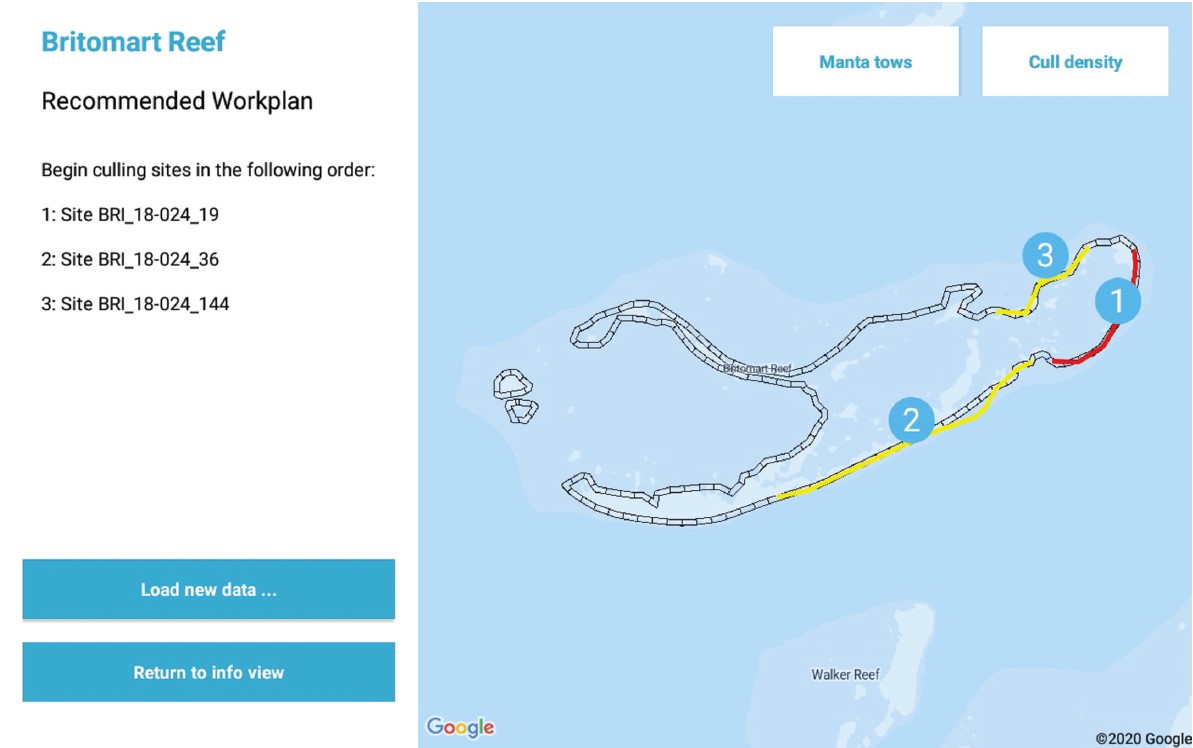
This dataset contains the code for the Android application “COTS Control Centre Decision Support Tool” (CCC-DST). The CCC-DST is one part of the “COTS Control Centre Decision Support System” (CCC-DSS) which is a hardware and software solution, comprising 32 Samsung Galaxy Tab Active2 tablets. The tablets run a kiosk operating system and provide three data collection apps, developed for GBRMPA by ThinkSpatial, and three decision support components developed by CSIRO as part of the NESP COTS IPM Research Program. The CCC-DST application is an implementation of the principles outlined in “An ecologically-based operational strategy for COTS Control” (Fletcher, et al., 2020). Methods: The COTS Control Centre Decision Support Tool (CCC-DST) is part of the COTS Control Centre Decision Support System (CCC-DSS). The CCC-DSS is a combined hardware and software solution developed by CSIRO as part of the National Environmental Science Program (NESP) Integrated Pest Management (IPM) Crown-of-thorns starfish (COTS) Research Program to help guide on-water decision making and implement the ecologically-informed management program outlined in the report “An ecologically-based operational strategy for COTS Control: Integrated decision making from the site to the regional scale” (Fletcher, Bonin, & Westcott, 2020). The COTS Control Centre DSS is built around a fleet of 32 ruggedised Samsung Galaxy Tab Active2 Android tablets, along with a suite of three data collection apps, developed for the Great Barrier Reef Marine Park Authority (GBRMPA) by ThinkSpatial, and three decision support components developed by CSIRO as part of the NESP COTS IPM Research Program. The fleet of tablets are able to be managed remotely, including locating hardware and updating software, using the Samsung Knox Manage Enterprise Mobility Management platform, and run a custom kiosk launcher. Data is shared between the apps that make up the CCC-DSS within a tablet using the Android file system, between tablets on a vessel independent of cellular connectivity with the Android Nearby Communications protocol, and with GBRMPA’s Eye on the Reef Database when cellular networking is available. In addition to designing and implementing the overarching CCC-DSS system, CSIRO has developed a suite of three software components, consisting of the main Decision Support Tool (CCC-DST), a Data Explorer functionality, which is currently implemented as part of the CCC-DST but may, in future, be separated into a second app, and a utility Data Sync Tool for sharing data between tablets when internet connectivity is not available. Details of the underlying philosophy and implementation notes of the CCC-DST can be found in the technical report: Fletcher C. S. and Westcott D. A. (2021) The COTS Control Centre: Supporting ecologically-informed decision making when and where the decisions need to be made. Report to the National Environmental Science Program. Reef and Rainforest Research Centre Limited, Cairns (189pp.). Architecture: In general, Android applications are designed to require minimal memory footprint by cycling data out of their sqlite database on the fly as required. This is an efficient method of designing lightweight apps coexisting on mobile hardware will limited memory and processing capacity. It works well for some of the tasks required of the NESP COTS Control Centre apps, but is not intuitively suited to all the functionality required. This is especially the case for situations where data must be compared longitudinally through time or across many Sites or Reefs in order to guide decision making. On the other hand, because the COTS Control Centre is run on dedicated hardware of known specification and containing only the suite of apps necessary to guide on-water actions, we can bias the design of our system towards functionality within the hardware being used, rather than optimising for universal efficiency. As a result, the COTS Control Centre apps were developed with a hybrid philosophy that aims to target the data loaded into memory to that required to inform a decision, and which structures the data in memory using custom classes that reflect the actual data being analysed. This approach puts an emphasis on both logical database design and well-structured custom types to support the functionality of the apps, each of which are described in further detail in the sections that follow. The apps were developed in stages, starting with prototypes early in 2016. As a result, they retain some legacy functionality, such as the use of loaders rather than the ViewModel and Room functionality introduced in Android after this time. They also include components, such as a ContentProvider framework, that were expected to be important at one stage in app development, but which are not deeply leveraged in the current configuration. The structure of the apps also reflects the fact that their development will continue to incorporate feedback from on-water operators, as well as scientific advances in biological understanding, field measurements, and management strategies. As a result, in some places a more general programming approach has been favoured over more optimised code in order to maintain or provide flexibility to incorporate new functionality in future. Note: The database file has been omitted from the source files. The details of the database layout can be found in the technical report (section 2.2): Fletcher C. S. and Westcott D. A. (2021) The COTS Control Centre: Supporting ecologically-informed decision making when and where the decisions need to be made. Report to the National Environmental Science Program. Reef and Rainforest Research Centre Limited, Cairns (189pp.) Format: Java application (Android) References: Fletcher C. S. and Westcott D. A. (2021) The COTS Control Centre: Supporting ecologically-informed decision making when and where the decisions need to be made. Report to the National Environmental Science Program. Reef and Rainforest Research Centre Limited, Cairns (189pp.) Fletcher C. S., Bonin M. C, Westcott D. A.. (2020) An ecologically-based operational strategy for COTS Control: Integrated decision making from the site to the regional scale. Reef and Rainforest Research Centre Limited, Cairns (65pp.). Data Location: This dataset is filed in the eAtlas enduring data repository at: data\custodian\2019-2022-NESP-TWQ-5\5.1_COTS-pest-management
-
This dataset consists of three data files (spreadsheets) from a two month aquarium experiment manipulating pCO2 and light, and measuring the physiological response (photosynthesis, growth, protein and pigment content) of the adult and juvenile stages of two species of tropical corals (Acropora tenuis and A. hyacinthus). Methods: We conducted a two-month, 24-tank experiment at AIMS’s SeaSim facility, in which recently settled juvenile- and adult-colonies of the corals Acropora tenuis and A. hyacinthus were exposed to four light treatments (high, medium, low and variable intensities), fully crossed with two levels of dissolved CO2 (400 and 900 ppm). The four light treatments used in the experiment (low, medium, high and variable) each had 12 hrs of light and a five hour ramp, but at different intensities. The high light treatment had a noon max of 500 µmol photon m-2 s-1 and a DLI of 12.6 mol photon m-2, the medium treatment had a noon max of 300 µmol photon m-2 s-1 and a DLI of 7.56 mol photon m-2, while the low light treatment had a noon max of 100 µmol photon m-2 s-1 and a DLI of 2.52 mol photon m-2. The variable treatment oscillated on a five day cycle, with four days at the low treatment intensity, a ramp day at the medium, then four days at the high treatment intensity. The mean DLI of the variable treatment was therefore the same as medium treatment. Light intensities were checked in each individual aquaria with a calibrated underwater light sensor (Licor, USA). The variable light treatment allowed us to investigate how these corals acclimate to a changing light environment, and to see if responses are due to limitation under low light, or inhibition under high light (i.e. coral responses in the variable treatment would resemble the low or high light treatments), or whether light has a cumulative effect regardless of variability (i.e. coral responses in the variable treatment would resemble the medium light treatment). Adult corals were collected from Davies Reef (18.30 S, 147.23 E) while juveniles were spawned from adults at AIMS’s SeaSim facility. After two months of experiment exposure, growth (change in corallite number) and survivorship were assessed in the juvenile corals from photographs, while growth (buoyant weight changes), and protein and pigment content were assessed in the adults after tissue stripping following standard procedures. Briefly, each adult coral nubbin was water-picked in 10 mL of ultra-filtered seawater (0.04 µm) to remove coral tissue. This tissue slurry was then homogenised and centrifuged to separate coral and symbiont components following. Total coral protein content was quantified from the coral tissue supernatant with the DC protein assay kit (Bio-Rad Laboratories, Australia), while Symbiodinium pigments in the pellet were determined spectrophotometrically (Lichtenthaler 1987, Richie 2008). Protein content was standardised to nubbin surface area, estimated with the single wax-dipping technique (Veal et al. 2010), while pigment content was standardised by nubbin surface area, as well as by protein content. A series of photophysiological measurements for the effective (PhiPSII) and maximum (Fv/Fm) quantum yield of photosystem II were made on the adults with a pulse amplitude modulated fluorometer over the final ten days of the experiment. Photosynthetic pressure (Qm: 1 - PhiPSII / Fv/Fm) and relative electron transport rate (rETR: PhiPSII * PAR) were calculated (Ralph et al. 2016) to see how they were responding to their light environment. References: Lichtenthaler HK (1987) Chlorophylls and carotenoids: Pigments of photosynthetic biomembranes. Methods in Enzymology, 148, 350–382. Ralph PJ, Hill R, Doblin MA, Davy SK (2016) Theory and application of pulse amplitude modulated chlorophyll fluorometry in coral health assessment. In: Diseases of Coral, pp. 506–523. Ritchie RJ (2008) Universal chlorophyll equations for estimating chlorophylls a, b, c, and d and total chlorophylls in natural assemblages of photosynthetic organisms using acetone, methanol, or ethanol solvents. Photosynthetica, 46, 115–126. Veal CJ, Carmi M, Fine M, Hoegh-Guldberg O (2010) Increasing the accuracy of surface area estimation using single wax dipping of coral fragments. Coral Reefs, 29, 893–897.
-
This data set contains high frequency logging data to measure water depth, water temperature and electrical conductivity in project wetland sites. Coastal wetlands adjacent to the Great Barrier Reef (GBR) have incredible environmental, cultural and economic value. Despite this, many floodplains in the GBR catchments have been modified, impacted or lost entirely because of continuing land use change (such as agricultural, aquaculture, peri-urban/urban, and industrial expansion). Of the floodplains and their wetlands remaining many now provide severely reduced aquatic and avian habitat, due to alien weed infestation and poor water quality. A large number of coastal wetlands have also lost their connectivity with estuaries that flow into the GBR lagoon (e.g. due to earth bunding), which can impact marine and freshwater aquatic (diadromous) species that have a critical estuary lifecycle phase, and rely on this connectivity between the reef and shallow tidal and freshwater wetlands. The overall project objective is to evaluate existing and future coastal wetland system repair investments, covering a combination of project sites across Great Barrier Reef catchment area, to explicitly evaluate how these projects achieve biodiversity improvements, water quality benefits and connectivity with downstream marine coastal habitats. Methods: High frequency water depth logging Water depth, temperature and electrical conductivity were monitored by loggers (CTD-Diver, Eijkelkamp Soil & Water, Netherlands) located in the wetland. The loggers captured data from the bottom of the water column (~ 10 cm above the soil surface) every 20 minutes, and were downloaded as part of routine maintenance visits. Each logger was installed inside a PVC pipe (3m height, 90mm diameter) that was attached to a steel star picket. Loggers were attached to a stainless steel wire cord that was attached to the top of the PVC pipe for easy retrieval (downloading the data and maintenance). The loggers were downloaded every few months. For more details see: Canning, A., Adame F., Waltham, N. J., (2020) Evaluating the services provided by ponded pasture wetlands in Great Barrier Reef catchments – Tedlands case study. Report to the National Environmental Science Program. Reef and Rainforest Research Centre Limited, Cairns (23pp.). Waltham, N. J. & Canning, A. (2020) Exploring the potential of watercourse repair on an agricultural floodplain. Report to the National Environmental Science Program. Reef and Rainforest Research Centre Limited, Cairns (75pp.). Format: All data are in Excel format. References: Canning, A., Adame F., Waltham, N. J., (2020) Evaluating the services provided by ponded pasture wetlands in Great Barrier Reef catchments – Tedlands case study. Report to the National Environmental Science Program. Reef and Rainforest Research Centre Limited, Cairns (23pp.). Waltham, N. J. & Canning, A. (2020) Exploring the potential of watercourse repair on an agricultural floodplain. Report to the National Environmental Science Program. Reef and Rainforest Research Centre Limited, Cairns (75pp.). Data Location: This dataset is filed in the eAtlas enduring data repository at: data\custodian\2019-2022-NESP-TWQ-5\5.13_Coastal-wetland-systems-repair
-
This dataset shows the effects of herbicides (detected in the Great Barrier Reef catchments) on the growth rates (from cell density data) and photosynthesis (effective quantum yield) on the microalgae Chaetoceros muelleri during laboratory experiments conducted from 2018-2019. The aims of this project were to develop and apply standard ecotoxicology protocols to determine the effects of Photosystem II (PSII) and alternative herbicides on the growth and photosynthetic efficiency of the microalgae Chaetoceros muelleri. Growth bioassays were performed over 3-day exposures using herbicides that have been detected in the Great Barrier Reef catchment area(O’Brien et al. 2016). Acute effects of herbicides on the photophysiology of C. muelleri, measured by chlorophyll fluorescence as the effective quantum yield (Delta F/Fm') were investigated in 48-well plates using imaging PAM fluorometry after 24 h herbicide exposure(Mercurio et al. 2018, Schreiber et al. 2002). These toxicity data will enable improved assessment of the risks posed by PSII and alternative herbicides to microalgae for both regulatory purposes and for comparison with other taxa. Methods: The ochrophyte Chaetoceros muelleri (Lemmermann)(Lemmermann 1896) (CS-176) was purchased from the Australian National Algae Supply Service, Hobart (CSIRO). Cultures were established in Guillard’s f2 marine medium(Guillard and Ryther 1962) (0.5 ml l-1 of AlgaBoost F/2, AusAqua in 0.2 µm-filtered seawater (FSW)) and cultivated in sterile 500 ml Erlenmeyer flasks as batch cultures in exponential growth phase with weekly transfers of 70 ml of C. muelleri suspension to 350 ml f2 medium. Cultures were aerated and maintained at 26 ± 1°C, 35 psu and under a 12:12 h light:dark cycle (100-110 µmol photons m–2 s-1, Osram Lumilux Cool White 36 W). Herbicide stock solutions were prepared using PESTANAL (Sigma-Aldrich) analytical grade products (HPLC greater than or equal to 98%): diuron (CAS 330-54-1), tebuthiuron (CAS 34014-18-1), propazine (CAS 139-40-2), and haloxyfop-p-methyl (CAS 72619-32-0). The selection of herbicides was based on application rates and detection in coastal waters of the GBR(Grant et al. 2017, O’Brien et al. 2016). Stock solutions were prepared in sterile 1 l glass Schott bottles using milli-Q water or FSW. Diuron was dissolved using HPLC-grade ethanol (< 0.001 % (v/v) in exposures). Haloxyfop-p-methyl was dissolved in dimethyl sulfoxide (DMSO) (less than or equal to 0.006 % (v/v) in exposure). No solvent carrier was used for the preparation of the tebuthiuron and propazine stock solutions. Cultures of C. muelleri were exposed to a range of herbicide concentrations over a period of 72 h. Inoculum was taken from cultures in exponential growth phase (4-day-old with cell density approximately 1x10⁶ cell ml-1). Individual C. muelleri working suspensions (3x10³ cells ml-1) for each herbicide treatment were prepared in 100 ml Schott bottles and dosed with a series of herbicide concentrations. In each toxicity test, a control (no herbicide) and reference (4 µg l-1 diuron) treatments were added to support the validity of the test protocols and to monitor continued performance of the assays. Replicates (n = 5) of 10 ml of each treatment were transferred into sterile 20 ml scintillation vials and incubated at 26.0 ± 0.6 °C under a 12:12 h light:dark cycle (100-110 µmol photons m–2 s–1, Osram Lumilux Cool White 36 W). Sub-samples (0.5 ml) were taken from each replicate to measure cell densities of algal populations at 0 h and 72 h using a flow cytometer (BD Accuri C6, BD Biosciences, CA, USA). Specific growth rates (SGR) were expressed as the logarithmic increase in cell density from day i (ti) to day j (tj) as per equation (1), where SGRi-j is the specific growth rate from time i to j; Xj is the cell density at day j and Xi is the cell density at day i (OECD 2011). SGR i-j = [(ln Xj - ln Xi )/(tj - ti )] (day-1) (1) SGR relative to the control treatment was used to derive chronic effect values for growth inhibition. A test was considered valid, if the SGR of control replicates was greater than or equal to 0.92 day-1 (OECD 2011). Physical and chemical characteristics of each treatment were measured at 0 h and 72 h including pH, salinity and dissolved oxygen. Temperature was logged in 10-min intervals over the total test duration. Analytical samples were taken at 0 h and 72 h. Acute effects of herbicides on the photophysiology of C. muelleri, measured by chlorophyll fluorescence as the effective quantum yield (Delta F/Fm'), were investigated in 48-well plates using imaging PAM fluorometry (I-PAM, Walz, Germany)(Mercurio et al. 2018, Schreiber et al. 2002) following a single 12:12 h light:dark cycle (100-110 µmol photons m–2 s–1). Light adapted minimum fluorescence (F) and maximum fluorescence (Fm') were determined and effective quantum yield was calculated for each treatment as per equation (2)(Schreiber et al. 2002). Delta F/Fm’ = (Fm’-F)/Fm’ (2) Imaging PAM settings were set to actinic light = 1 (corresponding to photosynthetically active radiation (PAR) of 90-100 µmol photons m-2 s-1), measuring intensity = 9, gain = 1; damp = 2. Mean percent inhibition in SGR and Delta F/Fm' of each treatment relative to the control treatment was calculated as per equation (3)(OECD 2011), where Xcontrol is the average SGR or Delta F/Fm' of control and Xtreatment is the average SGR or Delta F/Fm' of single treatments. % Inhibition = [(X control - X treatment )/X control] x 100 (3) Format: Chaetoceros muelleri herbicide toxicity data_eAtlas.xlsx Data Dictionary: There are two tabs for each herbicide in the spreadsheet. The first tab corresponds to the specific growth rate (SGR) data; the second tab is the pulse amplitude modulation (PAM) fluorometry data. The last tab shows the measured water quality (WQ) parameters (pH, salinity, dissolved oxygen (DO), and temperature) of four herbicide tests. Diu – Diuron Teb – Tebuthiuron Halo – Haloxyfop Prop – Propazine For each ‘herbicide’_SGR tab: SGR = specific growth rate – the logarithmic increase from day 0 to day 3 Nominal (µg/L) = nominal herbicide concentrations used in the bioassays; SC denotes solvent control which is no herbicide and contains less than 0.006% v/v solvent carrier as per the treatments; D4 denotes diuron reference at 4 µg/L Measured (µg/L) = measured concentrations analysed by The University of Queensland Rep = Replicate: for SGR, notation is 1-5; for PAM data, notation is 1-5 T3_CellsPer_ml = cell density at day 3 ln(day3) = natural logarithm of cell density at day 3 Average T0_CellsPer_ml = average cell density at day 0 ln(Day0) = natural logarithm of cell density at day 0 For each ‘herbicide’_PAM tab: PAM = pulse amplitude modulated fluorometry to calculate effective quantum yield (light adapted) Nominal (µg/L) = nominal herbicide concentrations used in the bioassays; SC denotes solvent control which is no herbicide and contains less than 0.006% v/v solvent carrier as per the treatments; D4 denotes diuron reference at 4 µg/L Measured (µg/L) = measured concentrations analysed by The University of Queensland Rep = Replicate: for SGR, notation is 1-5; for PAM data, notation is 1-5 Delta F/Fm' = effective quantum (light adapted) yield measured by a Pulse Amplitude Modulated (PAM) fluorometer References: Grant, S., Gallen, C., Thompson, K., Paxman, C., Tracey, D. and Mueller, J. (2017) Marine Monitoring Program: Annual Report for inshore pesticide monitoring 2015-2016. Report for the Great Barrier Reef Marine Park Authority, Great Barrier Reef Marine Park Authority, Townsville, Australia. 128 pp, http://dspace-prod.gbrmpa.gov.au/jspui/handle/11017/133 25 O’Brien, D., Lewis, S., Davis, A., Gallen, C., Smith, R., Turner, R., Warne, M., Turner, S., Caswell, S. and Mueller, J.F. (2016) Spatial and temporal variability in pesticide exposure downstream of a heavily irrigated cropping area: application of different monitoring techniques. Journal of Agricultural and Food Chemistry 64(20), 3975-3989. OECD (2006) Current approaches in the statistical analysis of ecotoxicity data. OECD Publishing. OECD (2014) Test No. 238: Sediment-Free Myriophyllum Spicatum Toxicity Test, OECD Guidelines for the Testing of Chemicals, Section 2, OECD Publishing, Paris. Pereira, A.L., and Carrapiço, F. (2009) Culture of Azolla filiculoides in artificial conditions. Plant Biosystems, 143(3), 431-434 Rueden, C.T., Schindelin, J., Hiner, M.C. et al. (2017) ImageJ2: ImageJ for the next generation of scientific image data. BMC Bioinformatics 18:529, PMID 29187165, doi:10.1186/s12859-017-1934-z Data Location: This dataset is filed in the eAtlas enduring data repository at: data\nesp3\3.1.5_Pesticide-guidelines-GBR
-
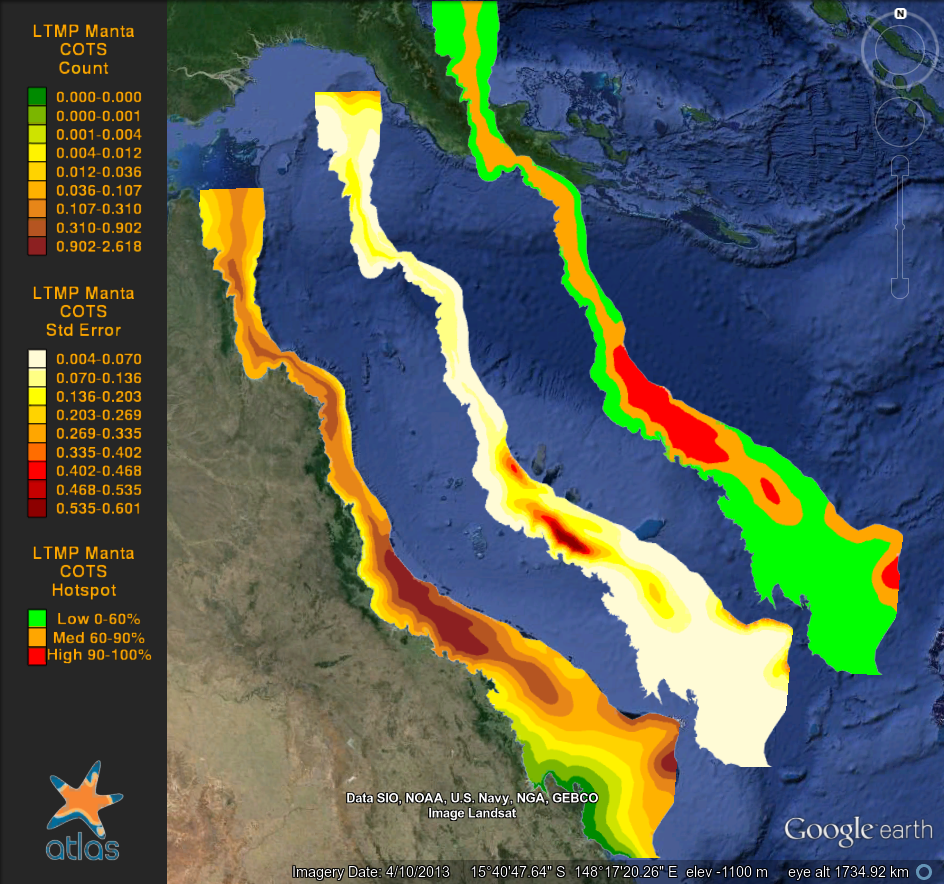
The purpose of this study is to quantify spatial and temporal changes in the density of crown-of-thorns starfish and benthic cover in the Great Barrier Reef. Broad-scale manta tow surveys have been conducted by the Long-Term Monitoring Program (LTMP) of the Australian Institiute of Marine Science since 1986, counting crown-of-thorns-starfish (COTS, Acanthaster planci). COTS densities fluctuates over years forming southward bound ‘waves’ (the incidence of reefs with new active outbreaks moving south over time, due to the southward transport of larvae by the East Australian Current). Outbreaks in the Swains sector appear to occur independently of the main southward moving wave of COTS outbreaks. The highest overall mean number of COTS per tow was 1.17 in 1988. Active or incipient outbreaks were recorded on 16% and 11% of the reefs surveyed reefs in 2004 and 2005, respectively. The highest percentage of reefs with active outbreaks was 17%, recorded in 1987, 1999 and 2000. Benthic cover of hard corals, soft corals and dead corals was also estimated on each tow, providing comprehensive estimates of cover around the whole perimeter of reefs. As part of the Reef Atlas project (now the eAtlas) the manta tow observations were interpolated over the whole GBR by Glenn De'ath using Generalized Additive Models with a Quasibinomial fit. This produced a gridded version of the dataset and is available as a KML and ASCII grid file in WGS84 projection.
-
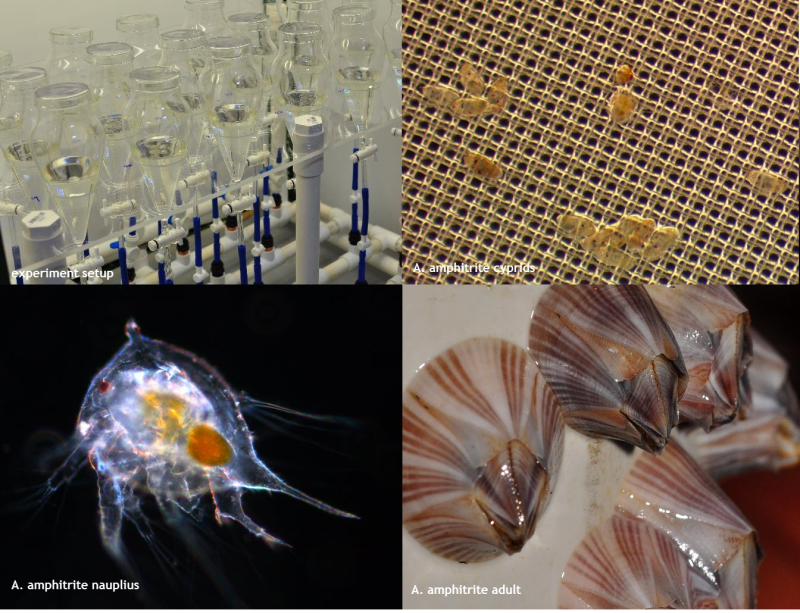
This dataset shows the effects of of the insecticide imidacloprid and the fungicide propiconazole on larval development of the acorn barnacle Amphibalanus amphitrite experiments conducted in 2018 and 2019. The aim of this project was to apply standard ecotoxicology protocols to determine the effects of the insecticide imidacloprid and the fungicide propiconazole on larval development rate of the acorn barnacle Amphibalanus Amphitrite. Larval development bioassays(4-d exposures) were conducted using a fungicide and insecticide that have been detected in the Great Barrier Reef catchment area (O'Brien et al., 2016). These toxicity data will enable improved assessment of the risks posed by pesticides to marine crustaceans for both regulatory purposes and for comparison with other taxa. Methods: Pesticide stock solutions were prepared using PESTANAL (Merck) analytical grade products (purity greater than or equal to 98%): imidacloprid (CAS 138261-41-3) and propiconazole (CAS 60207-90-1). This selection was based on application rates and detection in coastal waters of the GBR (O’Brien et al., 2016; Grant 2017). Pesticide stock solutions (100 – 1,000 mg L-1) were prepared by dissolving aliquots of the pure compounds in ultrapure water using clean, acid-washed (5% nitric acid) glass screw-top containers. Acetone was used to dissolve the imidacloprid and propiconazole (less than or equal to 0.01 % (v/v) in exposure solutions). Stock solutions were stored refrigerated and in the dark. Broodstock barnacles had been grown for several generations in the AIMS-NT aquaria facility (originally sourced from Darwin Harbour – 12°26'57.48"S, 130°51'7.51"E). Broodstock were fed freshly hatched brine shrimp (Artemia salina) and live rotifers daily. Broodstock were spawned as previously described (van Dam et al., 2016) and nauplii collected. Tests were conducted as previously described (van Dam et al., 2016). Nauplii were exposed in a custom-designed experimental test system that allowed for constant movement of the exposure media. The system consisted of a series of silanized glass funnels in which nauplii were exposed to increasing concentrations of imidacloprid or propiconazole and tested against control nauplii. Generally, a total of 24 funnels were used for 7 treatment concentrations and a control group, thus allowing for 3 replicate funnels per treatment. Each treatment vessel contained 100 mL exposure media, 50 newly released stage II nauplii and 1 x 10⁷ cells of rinsed Chaetoceros muelleri. Every 24 h, 1 x 10⁷ cells of rinsed C. muelleri were added to each funnel. After 96 h exposure, funnel contents were drained over a 150 µm nitrile mesh. The mesh was examined under a stereomicroscope and the number of cyprids and settled larvae scored. Quality control criteria (> 70% survival in control group) for test acceptability were met for each test used to derive toxicity estimates. Treatment effects were quantified by the percentage successful transition to cyprid in treatment groups relative to controls. Following prescribed statistical procedures (OECD 2006) the R package DRC (R-project 2015, Ritz & Streibig 2005), was used to model the test data and calculate toxicity estimates. Regression models evaluated included log-logistic and Weibull models of different levels of parametrisation. Model comparisons were conducted using the Akaike Information Criterion (AIC) and models that best described the data were applied to approximate pesticide concentrations eliciting 10 and 50% inhibition of successful transition relative to control animals (EC10 and EC50, respectively). The associated 95% confidence limits were estimated using the delta method. Format: The dataset is summarised in one file named ‘Amphibalanus amphitrite pesticide toxicity data_eAtlas.xlsx’ Data Dictionary: The excel spreadsheet has one tab for each pesticide. The last tab of the dataset shows the measured (start and end of test) water quality (WQ) parameters (pH, salinity, dissolved oxygen (DO), and temperature) of each pesticide test. For each ‘pesticide’_Development tab: Nominal (µg/L) = nominal herbicide concentrations used in the bioassays Measured (µg/L) = measured concentrations analysed by The University of Queensland Rep = replicate notation is 1-3 No. of nauplii larvae at start = number of larvae per replicate at start of test No. of cyprid larvae day 4 = number of cyprids observed per replicate at end of test References: O’Brien, D. et al. Spatial and temporal variability in pesticide exposure downstream of a heavily irrigated cropping area: application of different monitoring techniques. J. Agric. Food Chem. 64, 3975-3989 (2016). Grant, S. et al. Marine Monitoring Program: Annual Report for inshore pesticide monitoring 2015-2016. Report for the Great Barrier Reef Marine Park Authority, Great Barrier Reef Marine Park Authority, Townsville, Australia. 128 pp, http://dspace-prod.gbrmpa.gov.au/jspui/handle/11017/13325 (2017). van Dam, J. W. et al. A novel bioassay using the barnacle Amphibalanus amphitrite to evaluate chronic effects of aluminium, gallium and molybdenum in tropical marine receiving environments. Mar Pollut Bull 112, 427-435, doi:http://dx.doi.org/10.1016/j.marpolbul.2016.07.015 (2016). OECD. Current Approaches in the Statistical Analysis of Ecotoxicity Data., (OECD Publishing, 2006). R: A language and environment for statistical computing. R Foundation for Statistical Computing, Vienna, Austria. URL https://www.R-project.org/. (2015). Ritz, C. & Streibig, J. C. Bioassay analysis using R. Journal of Statistical Software 12, 1-22 (2005). Data Location: This dataset is filed in the eAtlas enduring data repository at: data\nesp3\3.1.5_Pesticide-guidelines-GBR
-
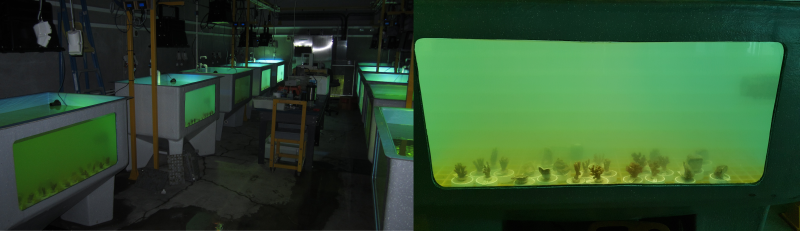
This dataset consists of one data file (spreadsheet) from a 28-d experiment examining sediment-induced changes in the spectral quality and quantity of light on three coral species (Acropora millepora, Pocillopora verrucosa and Montipora aequituberculata) and one encrusting sponge species (Cliona orientalis). The aim of the study was to use ecologically relevant turbidity and light profiles obtained from field-based data to test the effects of sediment induced spectral shifts and quantities of light on corals and sponges. Data from this experiment will help to derive more realistic thresholds to be applied during dredging operations. Methods: Three coral species (Acropora millepora, Pocillopora verrucosa and Montipora aequituberculata) and one encrusting sponge species (Cliona orientalis) were used in SeaSim experiments to examine the effects of sediment induced changes in the quality and quantity of light. A. millepora and M. aequituberculata were collected from Falcon Island (18° 45’ 56.4”S; 146° 32’ 02.7”) and P. verrucosa and C. orientalis were collected from Pelorus Island (18° 45’ 36.7”S; 146° 29’18.5” E). Corals were exposed to 5 different nominal suspended sediment concentrations (nominal SSC of 2.5, 5, 7.5, 10 and 15), with corresponding light profiles, for 28 days. Nephelometers used in the experimental tanks to maintain SSCs were calibrated with Formazin and set to measure Formazin Nephelometric Units (FNU), with water samples taken throughout the experiment (n=12) to relate FNU to SSCs (mg L-1). The gravimetric SSC was determined by filtering water samples (250 mL) through pre-weighed 0.4 µm polycarbonate filters, which were then rinsed with deionized water, dried at 60°C for 24 h and re-weighed. Photosynthetic active radiation (PAR) measurements were taken with a Jaz light meter (Jaz-ULM-200, Ocean Optics, the Netherlands) at peak intensity (12:00), with corresponding daily light integral (DLI) measurements obtained from the ramping profiles extracted from the programable logistic controller (PLC). Several response variables were measured at the end of the 28-d experiment: color (mean grey pixel), symbiont density (total Zoox and Zoox/cm2), chlorophyll a content (µg/cm2 and pg/cell), percent total lipids, ratio of storage to structural lipids (Stor:Struct) and lipid classes (WAX, TAG, FFA, ST, AMPL, PE, PSPI, PC, LPC). All species were photographed using a high-resolution digital camera (Nikon D810) with the following settings: ISO-100, F-29 and shutter speed 1/200. Changes in colour were examined using the hitogram function in ImageJ to obain mean pixel intensity values on a black and white scale (range 0-255) of representative live tissue, as previously described (Bessell-Browne et al., 2017). Surface area (cm2) of the corals were calculated using the wax dipping method (Stimson and Kinzie, 1991). This value was used to standardize zooxanthellae density and chlorophyll concentrations. To determine symbiotic zooxanthellae density, a volume of 0.4 mm3 from each blastate aliquot was counted six times using a Neubauer haemocytometer containing 8 µL of homogenised solution. Pigments were extracted using 95% ethanol and analysed on a Power Wave Microplate Scanning Spectrophotometer (BIO-TEK® Instruments, Inc., Vermont USA) as previously described (Pineda et al., 2016). For lipid analyses, total lipids and lipid classes were acquired by extracting freeze-dried samples following the air-spraying method procedures of (Conlan et al. 2017). Response data for all coral species can be found in the ‘coral’ tab, while the data for C. orientalis can be found in the ‘Cliona’ tab. Format: This dataset contains a single Excel file with a size of 96 KB. Data Dictionary: -SampleID: individual ID given to each replicate of the study -Species: Acropora millepora, Pocillopora verrucosa, Montipora aequituberculata -Tank/Ta: holding, 1 -10 -Nominal SSC: nominal suspended sediment concentration selected in the spectral model -Gravimetric SSC: actual suspended sediment concentration (mg L-1) corals/sponges were exposed to -PAR: maximum light intensity (photosynthetic active radiation; µmol quanta m-2 s-1) corals/sponges were exposed to -DLI: daily light integral (µmol quanta m-2 s-1) corals/sponges were exposed to -Time: day sampled -SA(cm2): surface area of the coral, calculated using the wax dipping method and used to standardize zooxanthellae density and chlorophyll concentrations. -Density of Zoox/cm2: density of zooxanthellae per cm2 tissue -Total Zoox: total number of zooxanthellae -pg Chl a/cell: picograms of chlorophyll a per zooxanthellae cell -Total Chl a: total amount of chlorophyll a per cm2 tissue -Mean grey pixel: mean grey pixel intensity value from imageJ analysis (0=black, 255=white) -%Lipid: the percent total lipid -WAX: percent wax ester (lipid class) -TAG: percent triacylglycerol (lipid class) -FFA: percent free fatty acid (lipid class) -ST: percent sterol (lipid class) -AMPL: percent acetone mobile polar lipid (lipid class) -PE: percent phosphatidylethanolaimine (lipid class) -PSPI: percent phosphatidylserine-phosphatidylinositol (lipid class) -PC: percent phosphatidylcholine (lipid class) -LPC: percent lyso-phosphatidylcholine (lipid class) Stor:Struct: ratio of storage (WAX, TAG, FFA) to structural lipids (all other classes listed) References: Stimson, J., and Kinzie, R.A. (1991). The temporal pattern and rate of release of zooxanthellae from the reef coral Pocillopora damicornis (Linnaeus) under nitrogen-enrichment and control conditions. Journal of Experimental Marine Biology and Ecology 153, 63-74. Bessell-Browne, P., Negri, A.P., Fisher, R., Clode, P.L., Duckworth, A., and Jones, R. (2017a). Impacts of turbidity on corals: The relative importance of light limitation and suspended sediments. Mar Pollut Bull 117, 161-170. Pineda, M.C., Strehlow, B., Duckworth, A., Doyle, J., Jones, R., and Webster, N.S. (2016). Effects of light attenuation on the sponge holobiont- implications for dredging management. Sci Rep 6, 39038. Conlan, J.A., Rocker, M.M., and Francis, D.S. (2017). A comparison of two common sample preparation techniques for lipid and fatty acid analysis in three different coral morphotypes reveals quantitative and qualitative differences. PeerJ 5, e3645. Data Location: This dataset is filed in the eAtlas enduring data repository at: data\nesp2\2.1.9_Dredging-marine-response
-
This dataset contains benthic photosynthetically active radiation (PAR; bPAR) at the Q-IMOS Myrmidon, Palm Passage and Heron Island South mooring stations from May 2016 through to November 2017. This dataset was collected to provide in situ reference data for calibration/validation of a remote sensing ocean color model to estimate bPAR (benthic photosynthetically active radiation) as part of NESP Tropical Water Quality Hub project 2.3.1. The mooring is maintained as part of the Queensland IMOS (Q-IMOS) mooring network, which collects oceanographic and water quality data at several stations. bPAR sensors were installed at four stations: Myrmidon (MYD), Palm Passage (PPS), Heron Island South (HIS) and Yongala (YGL). Methods: A WETLabs Environmental Characterization Optics (ECO) PARSB sensor was deployed and clamp-mounted to a permanent mooring wire at a fixed depth within the water column in each of three mooring sites, Myrmidon (MYD), Palm Passage (PPS), and Heron Island South (HIS). Each PAR sensor was programmed to collect 5-second blocks of data every 15 minutes. At the fourth site, Yongala (YGL), a SEABIRD SBE16PLUS V2 SEACAT profiler with PARSB auxiliary sensor “facing” upward was deployed 0.5 m above the bottom substrate. After each period of deployment, data were downloaded and the instrument’s optical component was checked, characterized and tested to ensure the quality and validity of the data between deployments. For each recovery period, the data were analysed and quality controlled such that: (i) data records in the beginning and end of each deployment were excluded to ensure that only stable PAR measurements were included in the analysis, (ii) data points when instrument failure was experienced due to instrument’s internal battery power problems were also excluded. Night-time values were forced to zero by applying an offset based on the dark count readings of the sensor for each deployment period. Summary of mooring stations and in situ data collection Mooring station: YGL Latitude: (°S) -19.302 Longitude: (°E) 147.621 Region: Shallow inshore, seasonally turbid Nominal station Depth: 30m Deployment start:19 Sep 2015 Mooring station: PPS Latitude (°S): -18.308 Longitude (°E): 147.167 Region: Deep, outer shelf, clear oceanic Nominal station Depth: 70m Deployment start: 28 May 2016 Mooring station: MYD Latitude (°S): -18.220 Longitude (°E): 147.344 Region: Deep, shelf edge, clear oceanic Nominal station Depth: 192m Deployment start: 25 May 2016 Mooring station: HIS Latitude (°S): -23.513 Longitude (°E): 151.955 Region: Shallow inshore, intermediate Nominal station Depth: 46m Deployment start: 03 Apr 2016 Data Dictionary: - bPAR: benthic photosynthetically available radiation - bPARoffset: offset (i.e., night time dark readings) corrected bPAR values Data Location: This dataset is filed in the eAtlas enduring data repository at: data\nesp2\2.3.1_Benthic-light
-
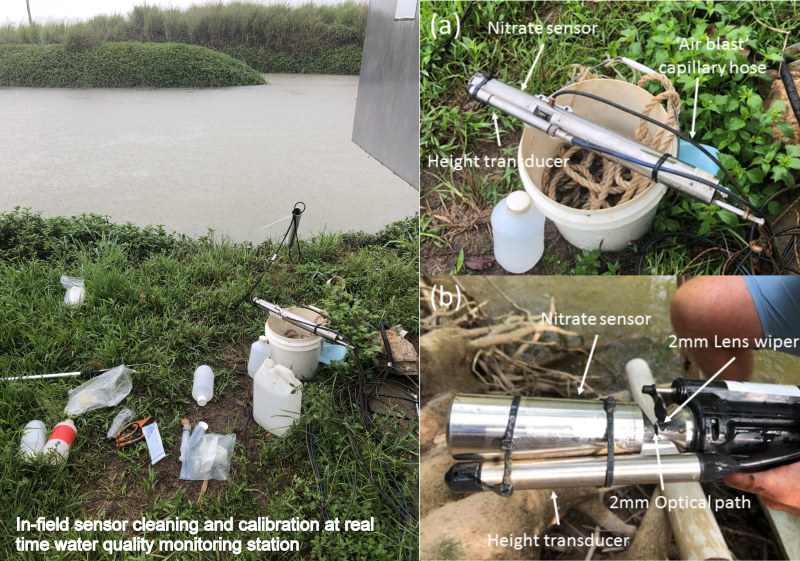
This dataset contains the results of the real-time water quality monitoring program (RTWQM) conducted across the Russell-Mulgrave catchment (south of Cairns) for "Project 25". Project 25 spanned two (2) NESP TWQ projects: 2.1.7 (2016 - 2018) and 4.8 (2019 - 2020), with the dataset for Project 4.8 also containing the data for Project 2.1.7. Data is the result of 2-3 hourly in situ logging of stream height (in metres) and nitrate concentrations (mg/L). * This dataset is under an embargo period for 18 months from the completion of the project extension (NESP TWQ 4.8). The broad aim of this study dataset was to characterise the water quality impacts and relative signatures of a range of distinct landuse types found across the Russell-Mulgrave catchment, and quantify the sugarcane industry’s specific role in end-of-catchment water quality. Subcatchment waterway sites were selected to represent the major land uses of the region, and were classed as sugarcane, urban, banana, or natural rainforest land use categories. Sites were also selected based on wet season accessibility to the site and the size of the waterway. A total of 9 sites were selected for the monitoring program through the period 2016-2018. Water quality monitoring for Project 25 is based around integration of relatively traditional monitoring approaches (discrete sample collection for subsequent laboratory analysis) as well as emerging real-time (sensor-based) monitoring approaches. The development of real-time information and feedback on local water quality dynamics is a relatively novel approach to landholder engagement that is yet to be meaningfully explored in natural resource management programs. Project 25 will trial these new technologies from both the perspective of an engagement-extension tool, and also their reliability in water quality monitoring applications across multiple spatial scales (paddock to catchment). This program utilises emerging real time water quality monitoring (RTWQM) technologies including sensor and telemetry technologies that provide continuous measurement of nitrogen water quality concentrations. Noting the inherent limitations associated with traditional grab sampling, such as extended analysis and holding times prior to reporting results, monitoring programs aiming at facilitating management change are increasingly shifting towards continuous measurements using in situ sensors. RTWQM equipment was deployed in three selected sub-catchments in the broader Project 25 monitoring design to provide real time water quality information on parameters such as nutrients (nitrate) back to local industry network. The spatial design aims to link to specific paddock management activities within the monitored catchment sites. This will eventually enable individual decisions making based on real rather than hypothetical average conditions. Localised comparative data will enable growers to compare performance with neighbours. The real time information from these systems provides a solid basis for farmers to adjust strategies at any time in a dynamic and autonomous manner. Methods: Real-time monitoring stations, based closely on those utilised in an earlier BBIFMAC case study (Burton et al., 2014), were installed at three sites identified in discussion with cane industry steering committee personnel, across the Russell-Mulgrave canefarming district. Sensors were current market?ready technologies, in this case TriOS NICO and OPUS optical sensors (https://www.trios.de/en/). Discrete manual sampling for nutrient water quality was also conducted at all sites on an approximate monthly basis during dry-season low flows to ground-truth sensor nitrate readings. Sampling frequency increased to daily (and occasionally several samples a day) during wet season flood events, particularly during early wet season ‘first-flush’ events to capture initial high concentration run-off dynamics from the immediate catchment area. Samples were manually collected by project scientists, or support staff trained individually in the correct sampling and quality assurance procedures developed in conjunction with the TropWATER Water Quality Laboratory. Calibration checks of each sensor were conducted at least every 3 months, using 0, 1 mg/L, 5 mg/L and 10 mg/L nitrate calibration standards provided by the TropWATER Water Quality Laboratory. Station design in 2017 initially involved water being pumped into a flow-through cell with the nitrate sensor housed in the sampling station. Some early power issues and equipment failures saw sites re-designed with the sensor installed instream in a PVC pipe, and subsequent measurements taken in situ. Optical sensors are susceptible to reduced performance from biofouling and sedimentation of the optical lens (Steven et al., 2013). Optical sensors utilised during Project 25 were initially cleaned utilising an integrated compressed air blast system to automatically clean the optical window. Early observations of optical window cleanliness, and periodic calibration testing of sensors highlighted that at least monthly physical cleaning of lens was also required for satisfactory performance at some sites. Recent development of automated, externally mounted lens wiper technologies by TriOS saw these new cleaning technologies added to some sites towards end of 2018. Other aspects of sampling station design and operation that can improve sensor performance also emerged during early stages of Project 25 sensor deployment and monitoring. The TriOS sensors utilised can operate theoretically with power supplies spanning 12V to 24V (±10%). Frequent initial situations of nitrate-N cycling emerged where system operating voltages approached or fluctuated around the lower 12V threshold (due to issues such as riparian shading of solar panels or sustained cloudy weather reducing battery recharge and voltage drop through cable lengths). Reconfiguring system design so nitrate sensor measurements were always taken at a nominal 24V power output reduced these effects significantly. Format: Data consists of an excel spreadsheet with stream height (m) and nitrate concentrations (mg/L) for each hydrological year of data recorded on separate, named spreadsheet tabs. References: Burton, E., T.J. McShane, and D. Stubbs D. 2014. A Sub Catchment Adaptive Management Approach To Water Quality in Sugarcane. Burdekin Bowen Integrated Floodplain Management Advisory Committee (BBIFMAC). 42pp. Steven, ADL, Hodge, J, Cannard, T, Carlin, G, Franklin, H, McJannet, D, Moeseneder, C, Searle, R, 2014. Continuous Water Quality Monitoring on the Great Barrier Reef. CSIRO Final Report to Great Barrier Reef Foundation, 158pp. Data Location: This dataset is filed in the eAtlas enduring data repository at: data\custodian\2016-18-NESP-TWQ-2\2.1.7_Engaging-farmers-WQ and data\custodian\2018-2021-NESP-TWQ-4\4.8_Project25 respectively.
-
This dataset shows the effects of herbicides (detected in the Great Barrier Reef catchments) on the growth rates (from cell density data) and photosynthesis (effective quantum yield) on the free-living form of the dinoflagellate coral symbiont Cladocopium goreaui during laboratory experiments conducted from 2017-2019. The aims of this project were to develop and implement standard ecotoxicology protocols to determine the effects of Photosystem II (PSII) and alternative herbicides on the growth and photosynthetic efficiency of the marine dinoflagellate Cladocopium goreaui. Bioassays were performed over 2-week exposures using herbicides that have been detected in the Great Barrier Reef catchment area (O'Brien et al., 2016). These toxicity data will enable improved assessment of the risks posed by PSII and alternative herbicides to coral endo-symbiotic algae for both regulatory purposes and for comparison with other taxa. Methods: A monoclonal strain of Cladocopium goreaui (formerly Symbiodinium clade C, (LaJeunesse et al., 2018) was isolated from the coral Acropora tenuis near Magnetic Island in Queensland, Australia (Australian Institute of Marine Science strain: SCF 055-01.10). Cultures were maintained in IMK media at 27 ± 1 °C and incubated at 14:10 h light:dark cycles under light intensity of 60-75 µmol m-2 s-1. C. goreaui cultures used for the bioassays were 14 days old and in the logarithmic growth phase. C. goreaui cells were transferred to 50 ml polypropylene tubes with IMK media to a final cell density of 1.7 -2.7 x 10⁴ cells mL-1. Treatments were run with 3-6 replicates, including IMK media controls, solvent controls and a reference toxicant control (6 µg L-1 diuron). C. goreaui cells were exposed for 14 d and temperature maintained at approximately 27°C in a refrigerated incubator shaker. Cells were kept suspended with shaking at 130 rpm. Bioassays were conducted at similar conditions to the mother culture. Herbicide stock solutions were prepared using analytical grade products (Sigma-Aldrich 98-99.5% purity): diuron (CAS 330-54-1), metribuzin (CAS 21087-64-9), hexazinone (CAS 51235-04-2), tebuthiuron (CAS 34014-18-1), bromacil (CAS 314-40-9), propazine (CAS 139-40-2), simazine (122-34-9), imazapic (CAS 104098-48-8), haloxyfop-p-methyl (CAS 72619-32-0). Stock solutions (5 - 600 mg L-1) were prepared in Milli-Q® water or filtered seawater. Diuron and metribuzin were dissolved using the carrier solvent ethanol (final concentration < 0.002% v/v in all exposure treatments). Haloxyfop and simazine were dissolved in the carrier solvent dimethyl sulfoxide (DMSO; final concentration < 0.006% v/v in all exposure treatments). No solvent carrier was used for the preparation of the remaining herbicide stock solutions. Herbicide analysis was done at the Queensland Alliance for Environmental Health Sciences (QAEHS), The University of Queensland using HPLC-MS/MS (SCIEX Triple QuadTM 6500 QTRAP® mass spectrometer Shimadzu Nexera X2 uHPLC sytem) (Mercurio et al., 2015, Mercurio, 2016). Flow cytometry was used to quantify specific growth rates of C. goreaui using a BD Accuri C6 flow cytometer. Cell densities were determined by plotting a 2-dimensional cytogram with fixed gating. Gating of cells was used to differentiate between C. goreaui and degraded chloroplasts of senescing cells or microbes. Specific growth rate (SGR) was calculated as the logarithmic increase in cell density from day 0 to day 14. SGR relative to the control treatment was used to derive effect values for growth inhibition. Specific growth rates (SGR) were expressed as the logarithmic increase in cell density from day i (ti) to day j (tj) as per equation (1), where SGRi-j is the specific growth rate from time i to j; Xj is the cell density at day j and Xi is the cell density at day i (OECD, 2011). SGR i-j = [(ln Xj - ln Xi )/(tj - ti )] (day-1) (1) SGR relative to the control treatment was used to derive effect values for growth inhibition. Effects of herbicides on the photosynthesis of C. goreaui were measured by chlorophyll fluorescence as the effective quantum yield (Delta F/Fm') using microscopy PAM fluorometry (Walz, Germany) (Schreiber, 1998). Light adapted minimum fluorescence (F) and maximum fluorescence (Fm') were determined and effective quantum yield was calculated for each treatment as per equation (2) (Schreiber et al., 2002). Settings for the bioassays were: actinic light = 1, measuring light = 10-12, damp = 2, gain = 3, actinic light width = 180 seconds and saturation pulse intensity = 2. Delta F/Fm’ = (Fm’-F)/Fm’ (2) Delta F/Fm' was measured after 13-15 d exposure. Percent inhibition was calculated relative to controls according to (3) % inhibition = [(Xcontrol – Xtreatment) /Xcontrol] x 100 (3) where Xcontrol is the mean SGR (or Delta F/Fm') of control and Xtreatment is the mean SGR or (Delta F/Fm') of treatments. Format: Cladocopium goreaui herbicide toxicity data_final_eAtlas.xlsx Data Dictionary: There are two tabs for each herbicide in the spreadsheet. The first of each pair is the specific growth rate (SGR) data, while the second of each pair is the pulse amplitude modulation (PAM) fluorometry (Delta F/Fm’ data. The last tab in the spreadsheet is the measured water quality (WQ) data for each herbicide bioassay. Diu – Diuron Brom – Bromacil Halo – Haloxyfop Hexa – Hexazinone Imaz – Imazapic Met – Metribuzin Prop – Propazine Sim – Simazine Teb – Tebuthiuron For each ‘herbicide’_SGR tab: SGR = specific growth rate – the logarithmic increase from day 0 to day 14 Nominal (µg/L) = nominal herbicide concentrations used in the bioassays; SC denotes solvent control which is no herbicide and contains less than 0.006% v/v solvent carrier as per the treatments; D6 denotes diuron reference at 6 µg/L Measured (µg/L) = measured concentrations analysed by The University of Queensland; Diuron reference toxicant at 6 µg/L was not measured Rep = Replicate: for SGR, notation is 1-10; for PAM data, notation is A, B, C T14_CellsPerMl = cell density at day 14 (except for simazine in which day 10 was used – notation ‘T10_CellsPerMl’) ln(Day 14) = natural logarithm of cell density at day 14 (except for simazine in which day 10 was used – notation ‘ln(Day 10)’) T0_CellsPerMl = cell density at day 0 ln(Day 0) = natural logarithm of cell density at day 0 For each ‘herbicide’_PAM tab. PAM = pulse amplitude modulated fluorometry to calculate effective quantum yield (light adapted) Nominal (µg/L) = nominal herbicide concentrations used in the bioassays; SC denotes solvent control which is no herbicide and contains less than 0.006% v/v solvent carrier as per the treatments; D6 denotes diuron reference at 6 µg/L Measured (µg/L) = measured concentrations analysed by The University of Queensland; Diuron reference toxicant at 6 µg/L was not measured Rep = Replicate: for SGR, notation is 1-10; for PAM data, notation is A, B, C No = individual C. goreaui cell used to measure effective quantum yield Delta F/Fm’ ' = effective quantum (light adapted) yield measured by a microscopy Pulse Amplitude Modulated (microscopyPAM) fluorometer ‘WQ’ tab: WQ = water quality DO = dissolved oxygen measured in mg/L and in % saturation Imazapic concentrations highlighted in red were removed from calculating mean WQ parameters since the pH at those concentrations were > 1.5 units from the control References: LAJEUNESSE, T. C., PARKINSON, J. E., GABRIELSON, P. W., JEONG, H. J., REIMER, J. D., VOOLSTRA, C. R. & SANTOS, S. R. 2018. Systematic revision of Symbiodiniaceae highlights the antiquity and diversity of coral endosymbionts. Current Biology. MERCURIO, P. 2016. Herbicide persistence and toxicity in the tropical marine environment. PhD University of Queensland. 148 p. DOI: 10.14264/uql.2016.722. MERCURIO, P., MUELLER, J. F., EAGLESHAM, G., FLORES, F. & NEGRI, A. P. 2015. Herbicide persistence in seawater simulation experiments. PLoS ONE, 10, e0136391. O’Brien, D., Lewis, S., Davis, A., Gallen, C., Smith, R., Turner, R., Warne, M., Turner, S., Caswell, S. and Mueller, J.F. (2016) Spatial and temporal variability in pesticide exposure downstream of a heavily irrigated cropping area: application of different monitoring techniques. Journal of Agricultural and Food Chemistry 64(20), 3975-3989. OECD 2011. Test No. 201: Freshwater Alga and Cyanobacteria, Growth Inhibition Test, OECD Guidelines for the Testing of Chemicals, Section 2, Paris, OECD Publishing. SCHREIBER, U. 1998. Chlorophyll fluorescence: New instruments for special applications. In: GARAB, G. (ed.) Photosynthesis: Mechanisms and Effects. Kluwer Academic Publishers, Dordrecht. SCHREIBER, U., MÜLLER, J. F., HAUGG, A. & GADEMANN, R. 2002. New type of dual-channel PAM chlorophyll fluorometer for highly sensitive water toxicity biotests. Photosynthesis Research, 74, 317-330. Data Location: This dataset is filed in the eAtlas enduring data repository at: data\nesp3\3.1.5_Pesticide-guidelines-GBR