 eAtlas Data Catalogue
elevation
Type of resources
Topics
Keywords
Contact for the resource
Provided by
Years
Formats
Representation types
Update frequencies
status
Scale
-
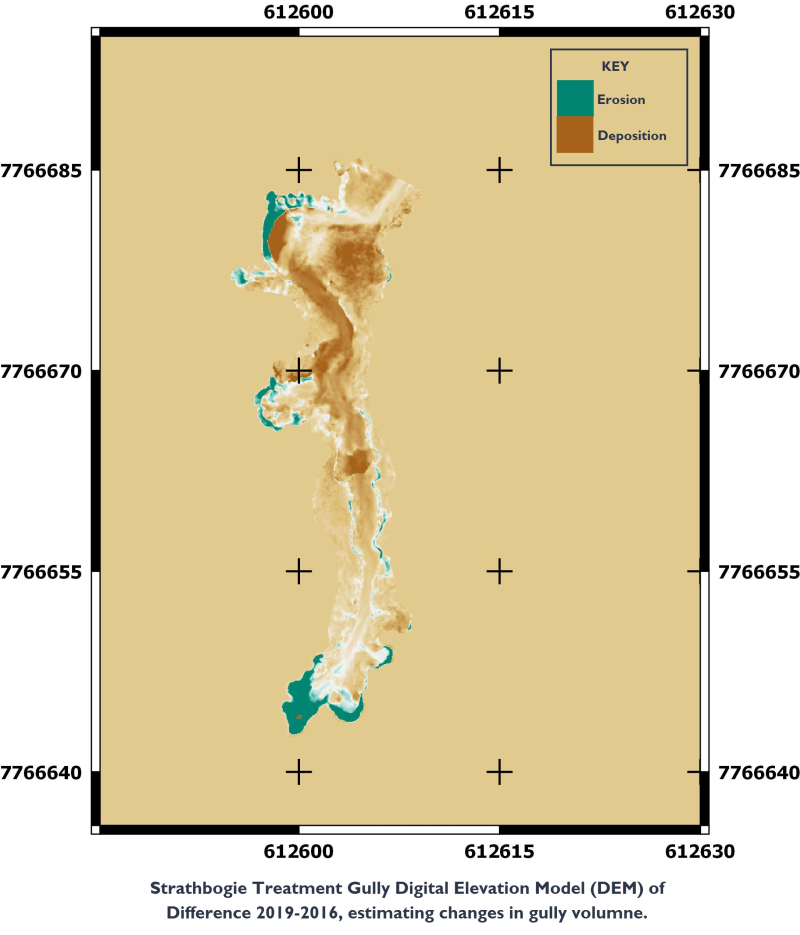
This dataset contains Riegl terrestrial laser scanner scans and their derived 5 cm gridded digital elevation models (DEMs) collected for up to 4 years between 2016 and 2019 for 4 paired Control/Treatment gully sites being monitored as part of NESP Project 2.1.4. Data collection also contains the DEMs of difference used to estimate changes in gully volume. The data in presented in this metadata are part of a larger collection and are intended to be viewed in the context of the project. For further information on the project, view the parent metadata record: Demonstration and evaluation of gully remediation on downstream water quality and agricultural production in GBR rangelands (NESP TWQ 2.1.4, CSIRO). Monitoring of these sites is continuing as part of NESP TWQ Project 5.9. Any temporal extensions to this dataset will be linked to from this record. Methods: Riegl terrestrial laser scanner (TLS) scans were collected for up to 5 years between 2015 to and 2019 for 4 paired Control/Treatment NESP gully sites. The fifth site, Mount Wickham, is not scanned. Each site was scanned once a year at the end of the wet season (generally April) using a Riegl terrestrial laser scanner. The TLS instrument used in this study was the RIEGL VZ400. The TLS was registered using five ground control points at each site. The control points consisted of a 50 cm star picket driven flush into the ground with a concrete collar. Survey bipods with reflectors were then placed over these marks to establish consistent xyz locations between scanners and for repeat surveys. To link RIEGL scans collected on the same day, additional ‘mobile’ reflectors were placed strategically around the sites. Registration was then performed by matching distances between reflector pairs (see Goodwin et al., 2016 for details). The RIEGL has an inbuilt fine-scan option to accurately locate reflector locations and is used to register separate scans into the same coordinate system with errors typically < 1 cm. These datasets are then projected into real world coordinates using the internal GPS and digital compass. The number of scans captured between sites varies due to differing morphological complexity and area to be mapped. Note that TLS scanning has not occurred at Mt Wickham. The georeferenced point clouds from each scan position are bundled as ZIP files by site and date. Naming conventions are explained in the data dictionary. The point clouds for each site and year were combined and converted into 5 cm digital elevation models (DEMs) by determining the minimum Z (elevation) value within a 5 cm grid pattern limited to an area covering the gully headcut and immediate downstream vicinity. A 3x3 grid cell median filter was used to remove spurious elevation values. Minimum Z is assumed to represent ground level. These DEMs are provided in TIFF format for each survey. Difference of DEMs (DoDs) were created by subtracting one DEM from another. Common extents were required for comparison of the DoDs. For the gully, a modified region grow approach was applied to an unclipped RIEGL DEM. This approach utilises a difference from mean elevation (DFME) (Evans and Lindsay, 2010) and a slope layer to detect the gully edges. A 50 cm buffer was then applied to ensure full capture of the gully edges. This dataset also includes hillshading derived from the DEMs. The original point cloud data is not available for download from the eAtlas (due to its large size), but is available on request from the Point of Contact. The DEMs are available for the following years and sites: Meadowvale: 2017, 2018, 2019 Minnievale: 2016, 2017, 2018, 2019 Strathbogie: 2016, 2017, 2018, 2019 Virginia Park: 2016, 2017, 2018, 2019 The DoDs correspond to the difference between the current year and the base year. Limitations of the data: Minimum Z DEM’s for representation of geomorphology ignore the possibility of overhangs. The raw DEMs provided include an area larger than the mapped gullies. These areas contain many anomalies as the scans were not intended to fully capture these areas. As a result the DEMs need to be masked before analysis is applied. Format: This dataset consists of multiple ZIP files containing LAZ files, ArcGIS shapefiles, JPGs and geoTIFF format grids Point_Clouds contains four folders, one for each paired Control/Treamenet gully monitoring site. Each folder contains Control and Treatment subfolders with zip files of the georeferenced TLS scans (as LAZ) by year. The file name convention is explained in the data dictionary. DEMs_and_DODs contains four ZIP files (one for each property) containing the DEMs and DEM of difference respectively in geoTIFF format at each control and treatment site for up to 5 years of monitoring between 2015 and 2019. File names For DEMs: <site>_<year>_DEM5cm.TIFF File names For Shaded relief DEMs: <site>_<year>_DEM5cm_HS.TIFF Where <site> is the 3 letter site code (see data dictionary) and <year> is the year surveyed (actual survey dates are captures in the naming convention of the Point Cloud files) NESP_2017_controlpoints_28355.shp contains the locations of the reference markers used for georeferencing the surveys. _META contains four zip files (one for each property) containing the DEMS and DODs in figures 21, 28, 36, and 44of the NESP report Bartley et al., 2019) All coordinates are GDA94 MGA zone 55. Data Dictionary: File naming convention for the Point clouds zip files (and LAZ files) <what>_<where>_<when>_<processing>[_optional][.suffix] <What> codes used: gp = ground platform v1 = Riegl VZ-400 dr = time-of-flight discrete return lidar <Where> - latitude longitude in decimal degrees <When> - YYYYMMDDTTTTTT <processing> ba3 = point clouds bc4 = Interpolated minimum heights to regular grid with median filtered applied m5 zone 55 The return deviation is stored in the ‘point_source_id’ field of the LAZ files and and the range is stored in the ‘GPS_time’ field. File naming Conventions for DEMs and DOD’s Site_Code used for file names are as follows: MIN = Minnievale MV = Meadowvale MW = Mount Wickham SB = Strathbogie VP = Virginia Park <T/C> - Treatment/Control Note: SBT is now the Strathbogie Control site SBC (to 2018) and SBT2 (after 2018) is now the Strathbogie Treatment site <year> = year measured DEM5cm = 5 cm gridded digital elevation model of ground surface DEM5cm_HS = hillshade of DEM DoD_<year2>-<year1> = DEM of difference Mask = mask showing extents used for DoD References: Bartley, R., Hawdon, A., Henderson, A., Wilkinson, S., Goodwin, N., Abbott, B., Bake, B., Boadle, D., and Ahwang, K. (2019) Quantifying the effectiveness of gully remediation on off-site water quality: preliminary results from demonstration sites in the Burdekin catchment (third wet season). Report to the National Environmental Science Programme. Reef and Rainforest Research Centre Limited, Cairns (115 pp.). Bartley, R., Goodwin, N., Henderson, A.E., Hawdon, A., Tindall, D., Wilkinson, S.N. and Baker, B., 2016. A comparison of tools for monitoring and evaluating channel change, Project 1.2b. Report to the National Environmental Science Programme. Reef and Rainforest Research Centre Limited, Cairns (36pp.). NR Goodwin, J Armston, I Stiller, J Muir. (2016) Assessing the repeatability of terrestrial laser scanning for monitoring gully topography: A case study from Aratula, Queensland, Australia, Geomorphology 262, 24-36. Data Location: This dataset is filed in the eAtlas enduring data repository at: data\NESP2\2.1.4_Gully_Remediation_Effectiveness
-
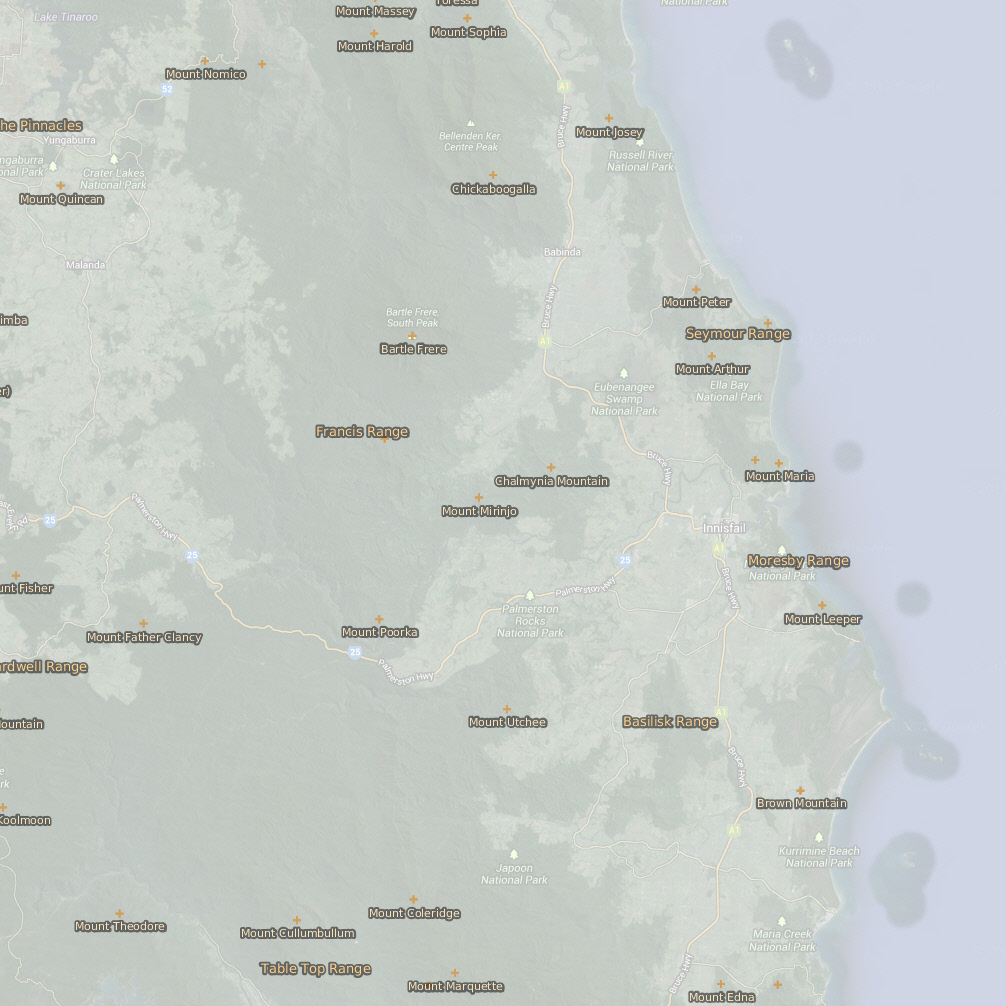
This dataset contains point features depicting mountains, peaks, mountain ranges and hills and their names. Ranges are located with a point or series of points in the approximate vicinity of the feature. Mountain data originated from 1:250,000 scale AUSLIG supplied topographic data (repromats). Corrections were made to locate the points accurately to the 1:100,000 scale National Topographic Map Series. Georeferenced Topographic Maps are dated 1966. This dataset consists of a 90 KB point shapefile containing 344 features. 95% of points within the Mountains coverage were located to the 1:100,000 scale Topographic maps Series. Some smaller hills, mountains and ranges shown on the 1:100,000 scale Topographic map Series, not in the original source data, have not been included in this dataset. 90% of the points are within +/- 50 metres of true position. Data reproduced with permission of Wet Tropics Management Authority This metadata was prepared for the eAtlas and is not authoritative. Please contact the Wet Tropics Management Authority for an authoritative record.
-
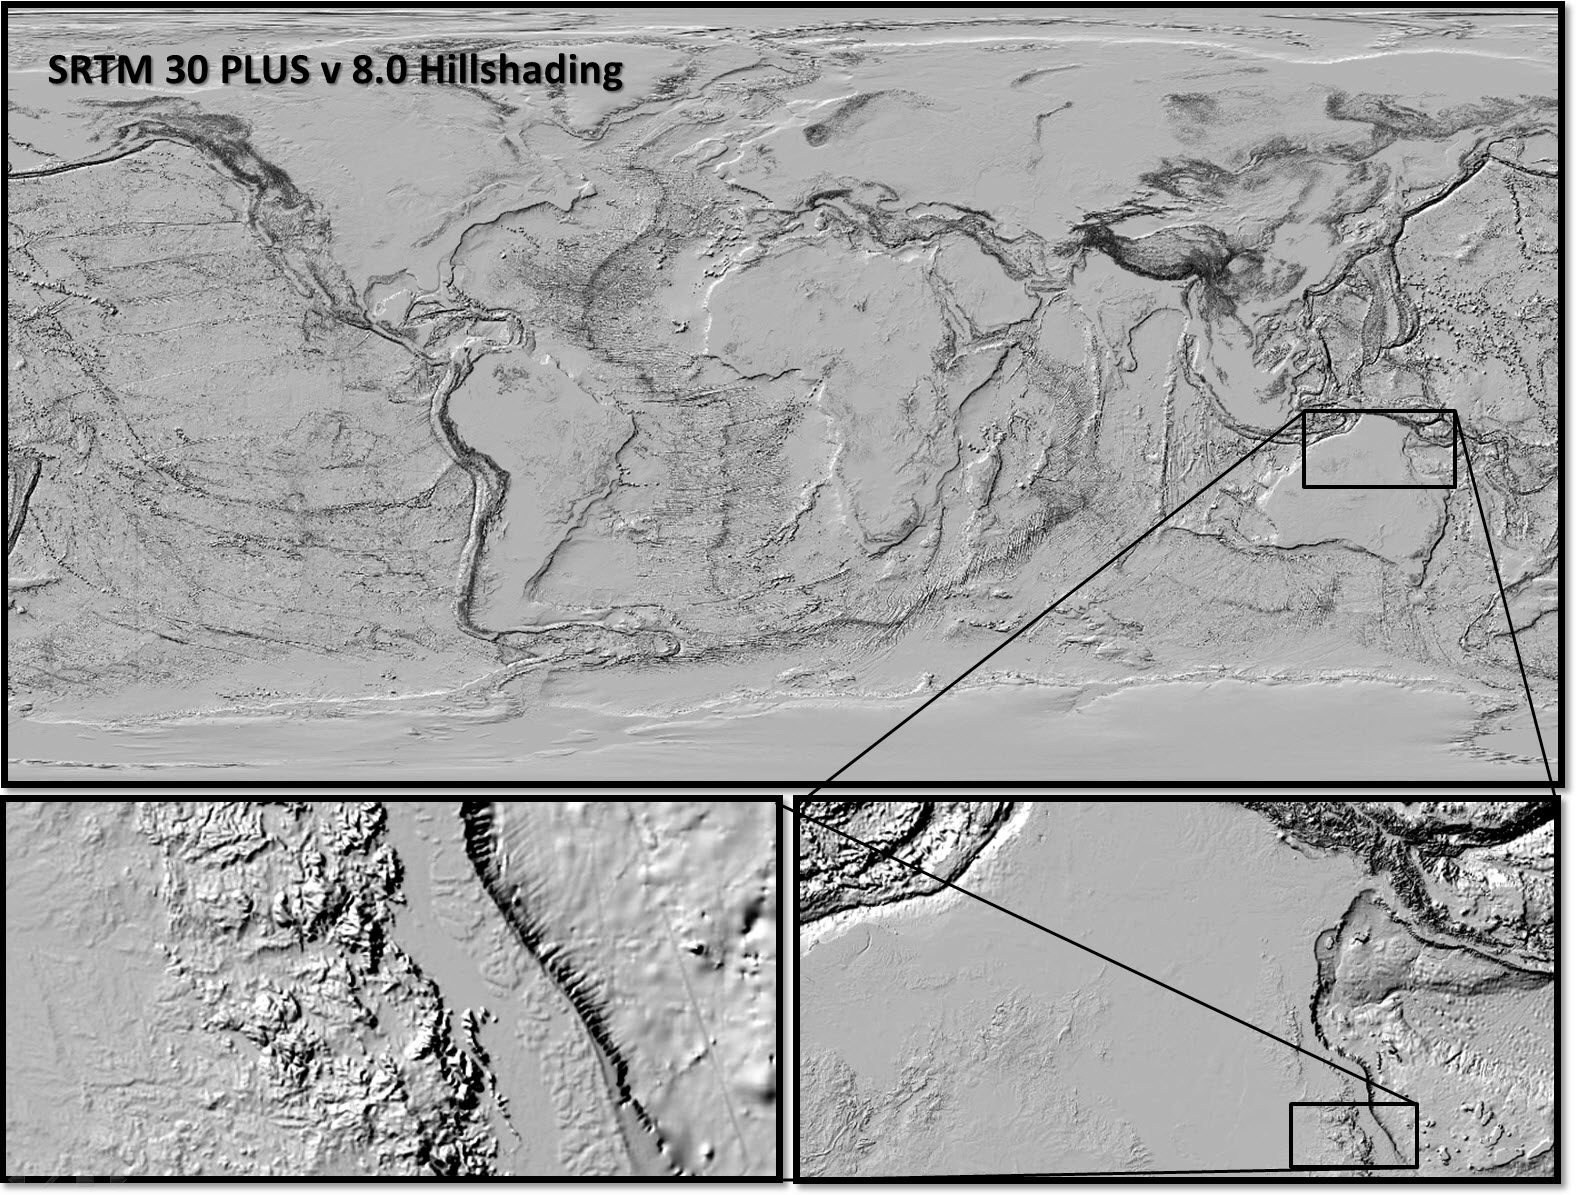
This dataset consists reprocessing and reformatting the SRTM30 PLUS v8.0 Digital Elevation Model (DEM) dataset developed by Scripps Institute Of Oceanography, University of California San Diego (UCSD) to produce a single raster covering the globe in GeoTiff format and create a full and low resolution hillshading from this DEM. The aim of this derived dataset is to reformat the data to allow easy use with GIS applications. Full resolution hillshading: The hillshading was produced by combining the 33 source DEMs using gdal_translate then processing using gdaldem with a z-factor of 0.0001. This output was then formatted as a JPEG compressed GeoTiff file with internal overviews (World_e-Atlas-UCSD_SRTM30-plus_v8_Hillshading.tif). Low resolution smoothed hillshading: A lower resolution of the hillshading (World_e-Atlas-UCSD_SRTM30-plus_v8_Hillshading-lr.tif) was also produced for for use when displaying zoomed out global maps. By making the hillshading smoother the bulk features (mountain ranges, etc) are easier to see. This was generated by subsampling the DEM by two times (down to 21600x10800 pixels) then smoothing it with a pixel Gaussian filter. This was achieved using gdalwarp to subsample the data. Gdalbuildvrt was then used to create a virtual dataset that included a 4 pixel Gaussian filter kernel. The hillshading was then applied to this filtered data source using gdaldem with a z-factor of 0.0003, which 3 times stronger than the high resolution version of this dataset.
-
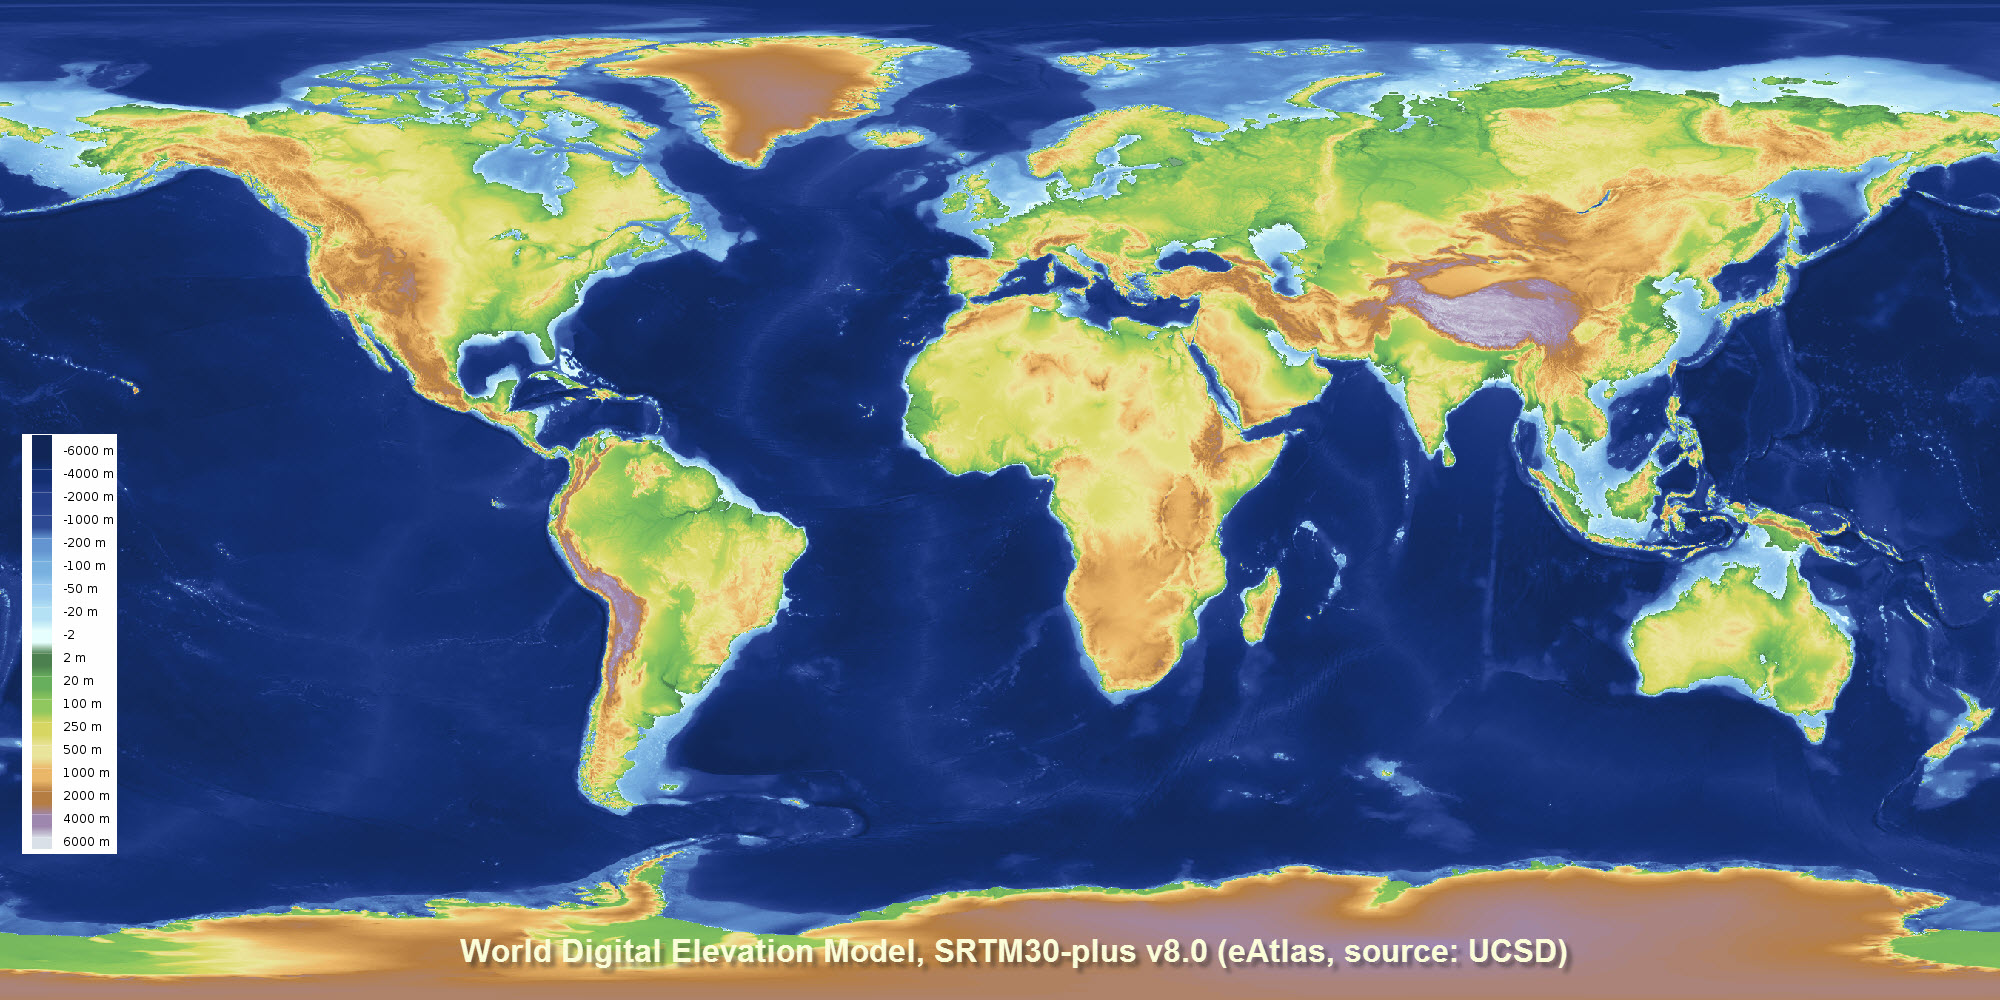
This dataset corresponds to a reformatting of the SRTM30_PLUS digital elevation dataset from 33 NetCDF files into a single GeoTiff for use in GIS applications. No other modifications to the data were done. The rest of this metadata describes the original SRTM30_PLUS dataset itself. Note: The SRTM15_plus dataset is a similar more recent, higher resolution bathymetry dataset https://topex.ucsd.edu/WWW_html/srtm15_plus.html. This dataset is a 30-arc second resolution global topography/bathymetry grid (SRTM30_PLUS) developed from a wide variety of data sources. Land and ice topography comes from the SRTM30 and ICESat topography, respectively. Ocean bathymetry is based on a new satellite-gravity model where the gravity-to-topography ratio is calibrated using 298 million edited soundings. The main contribution of this dataset is the compilation and editing of the raw soundings, which come from NOAA, individual scientists, SIO, NGA, JAMSTEC, IFREMER, GEBCO, and NAVOCEANO. The SRTM30_PLUS dataset developed by Scripps Institute Of Oceanography, University of California San Diego (UCSD). Land data are based on the 1-km averages of topography derived from the USGS SRTM30 grided DEM data product created with data from the NASA Shuttle Radar Topography Mission. GTOPO30 data are used for high latitudes where SRTM data are not available. Ocean data are based on the Smith and Sandwell global 1-minute grid between latitudes +/- 81 degrees. Higher resolution grids have been added from the LDEO Ridge Multibeam Synthesis Project, the JAMSTEC Data Site for Research Cruises, and the NGDC Coastal Relief Model. Arctic bathymetry is from the International Bathymetric Chart of the Oceans (IBCAO) [Jakobsson et al., 2003]. This data consists of 33 files of global topography in the same format as the SRTM30 products distributed by the USGS EROS data center. The grid resolution is 30 second which is roughly one kilometer. In addition the global data are also available in a single large file ready for GMT and as 33 NetCDF files. The eAtlas has also merged and formatted the data as a single GeoTiff file with overviews (1.6 GB). The pixel-registered data are stored in 33 files with names corresponding to the upper left corner of the array shown below. The data are also merged into a single large (1.9 Gbyte, 2-byte integer) file as well as smaller 1-minute and 2-minute netcdf versions. Matching files of source identification number are available for determining the data source for every pixel. This new version (v8.0) includes all of the multibeam bathymetry data collected by U.S. research vessels over the past three decades including 287 Scripps expeditions from research vessels Washington, Melville and Revelle. UCSD undergraduate student Alexis Shakas processed all the U.S. multibeam data and then worked with Google researchers on the global integration. The data is available from UCSD FTP server as 33 NetCDF files and from the eAtlas as a merged GeoTiff. If you are after high resolution bathymetry/elevation data for regional areas please check the related links. Reference, sounding data: Becker, J. J., D. T. Sandwell, W. H. F. Smith, J. Braud, B. Binder, J. Depner, D. Fabre, J. Factor, S. Ingalls, S-H. Kim, R. Ladner, K. Marks, S. Nelson, A. Pharaoh, R. Trimmer, J. Von Rosenberg, G. Wallace, P. Weatherall., Global Bathymetry and Elevation Data at 30 Arc Seconds Resolution: SRTM30_PLUS, Marine Geodesy, 32:4, 355-371, 2009. http://topex.ucsd.edu/sandwell/publications/124_MG_Becker.pdf Reference, gravity data: Sandwell, D. T., and W. H. F. Smith, Global marine gravity from retracked Geosat and ERS-1 altimetry: Ridge Segmentation versus spreading rate, J. Geophys. Res., 114, B01411, doi:10.1029/2008JB006008, 2009. http://dx.doi.org/10.1029/2008JB006008 eAtlas Processing: A set of Batch scripts were developed to perform the conversion of the data from NetCDF to GeoTiff and the generation of the hillshading. This processing was based on the GDAL command line tools. Full details of the processing can be found in the downloadable Scripts associated with this dataset. Data Location: This dataset is filed in the eAtlas enduring data repository at: data\NERP-TE\13.1_eAtlas\World_UCSD_SRTM30-plus
-
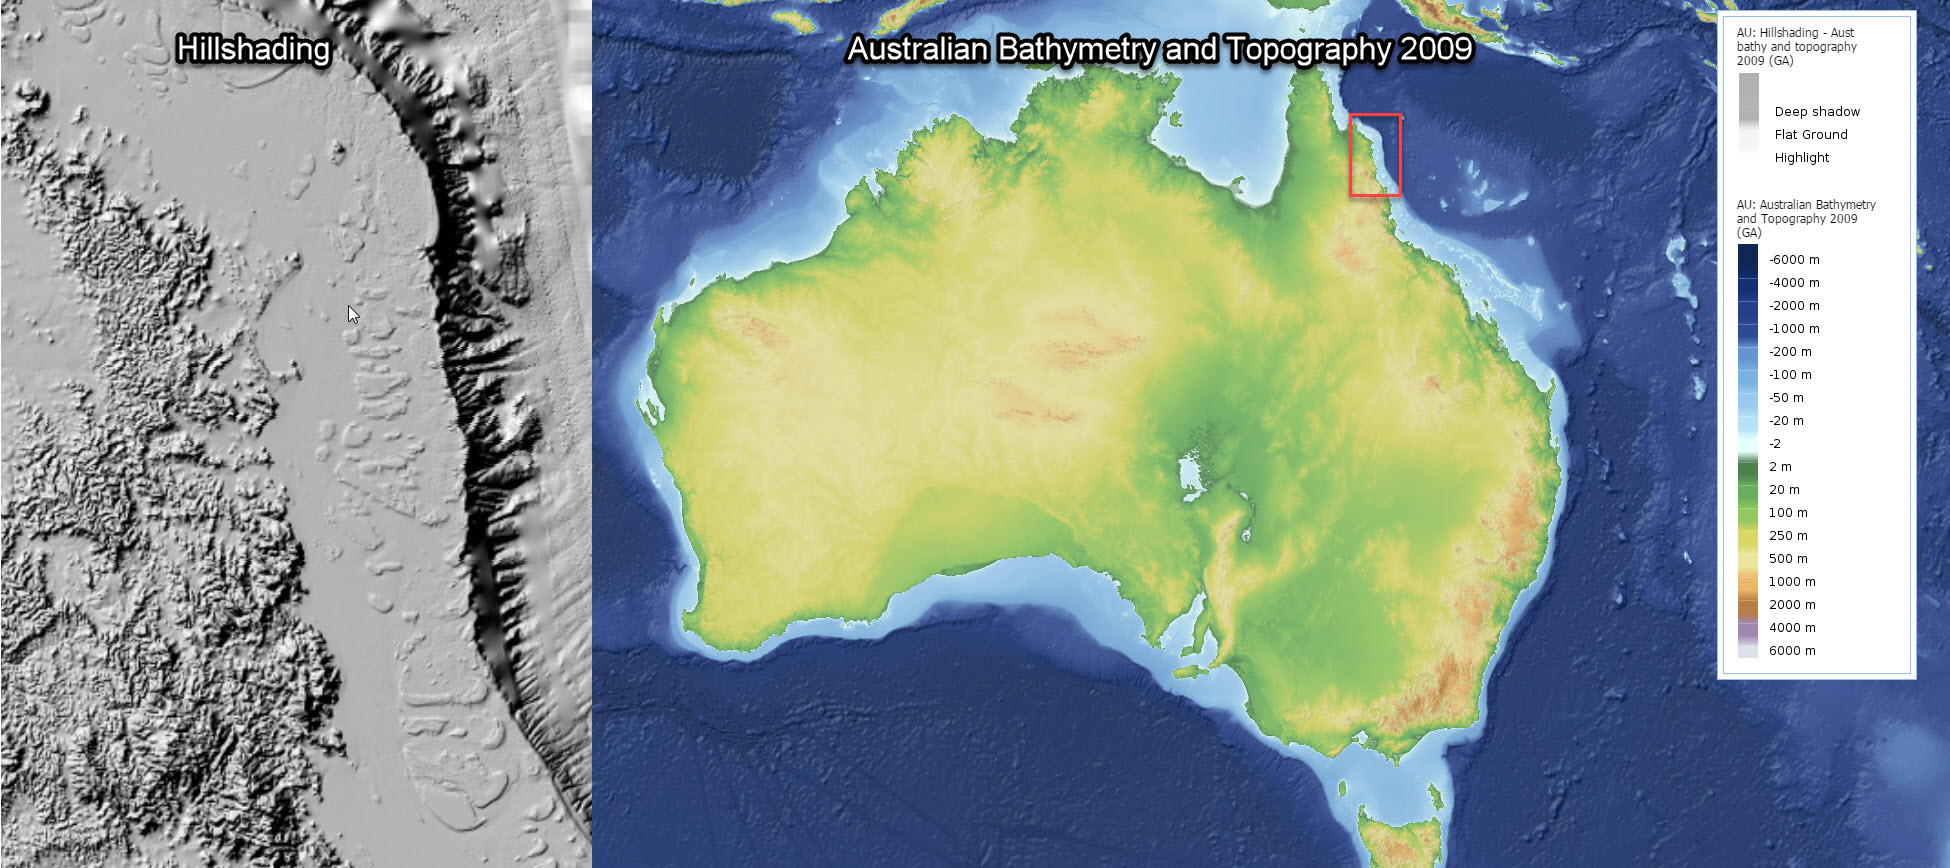
This dataset contains hillshading derived from the Digitial Elevation Model (DEM) dataset: Australian bathymetry and topography grid, June 2009 version 4 by Geoscience Australia. This dataset also contains the original DEM converted to a GeoTiff. The hillshading was produced using the gdaldem tool. The rest of this documentation is based on the metadata of the Australian bathymetry and topography grid itself. This grid is available from GA at http://dx.doi.org/10.4225/25/53D99B6581B9A . In 2005 Geoscience Australia and the National Oceans Office undertook a joint project to produce a consistent, high-quality 9 arc second (0.0025 deg or ~250m at the equator) bathymetric grid for Australian waters. In 2009 a number of new datasets were included in an updated version of the grid. The 2009 bathymetric grid of Australia has been produced to include recently acquired datasets, and solutions to issues identified in the previous version. The revised grid has the same extents as its 2005 counterpart, including the Australian water column jurisdiction lying between 92 deg E and 172 deg E, and 8 deg S and 60 deg S. The waters adjacent to the continent of Australia and Tasmania are included, as are areas surrounding Macquarie Island, and the Australian Territories of Norfolk Island, Christmas Island, and Cocos (Keeling) Islands. The area selected does not include Australia's marine jurisdiction offshore from the Territory of Heard and McDonald Islands and the Australian Antarctic Territory. This report details the datasets and procedures used to produce the 2009 bathymetric grid of Australia. As per the 2005 grid, the 0.0025 decimal degree (dd) resolution is only supported where direct bathymetric observations are sufficiently dense (e.g. where swath bathymetry data or digitised chart data exist) (Webster and Petkovic, 2005). In areas where no sounding data are available (in waters off the Australian shelf), the grid is based on the 2 arc minute ETOPO (Smith and Sandwell, 1997) and 1 arc minute ETOPO (Amante and Eakins, 2008) satellite derived bathymetry. The topographic data (on shore data) is based on the revised Australian 0.0025dd topography grid (Geoscience Australia, 2008), the 0.0025dd NZ topography grid (Geographx, 2008) and the 90m SRTM DEM (Jarvis et al, 2008). Format: DEM - GeoTiff LZW compressed, with internal overviews Hillshading - GeoTiff JPEG compressed (95% quality), with internal overviews Data Location: This dataset is filed in the eAtlas enduring data repository at: data\other\AU_GA_Bathymetry-2009
-
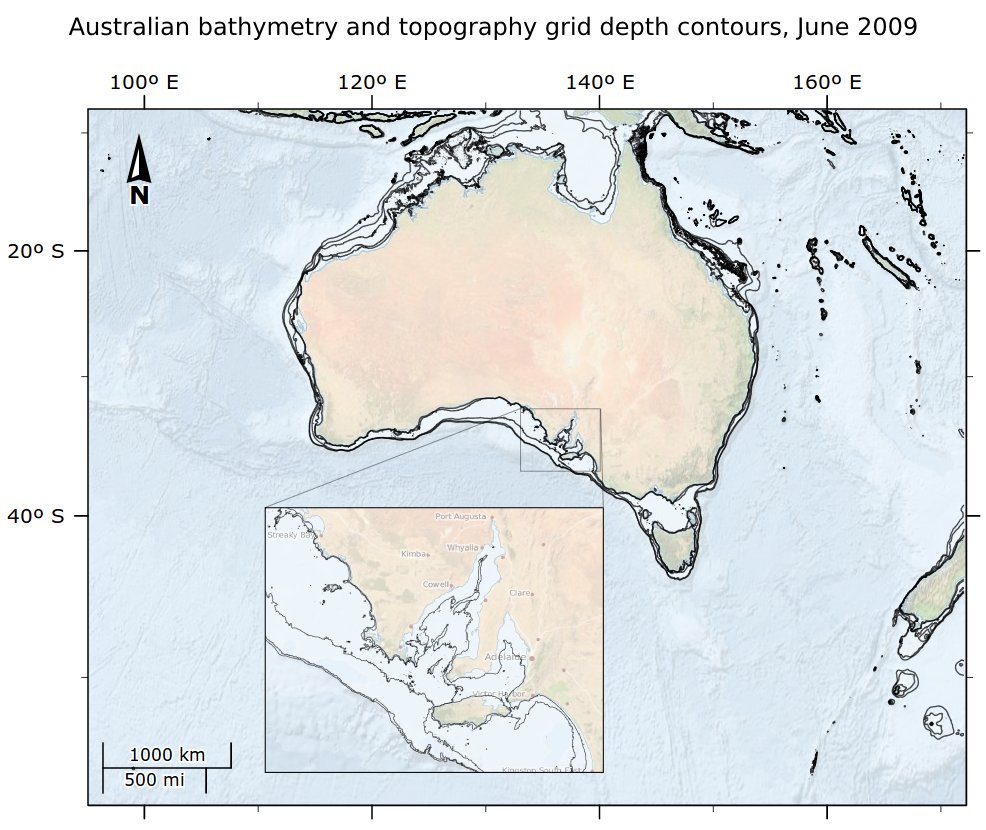
This dataset contains contours generated from the Australian bathymetry and topography grid, June 2009 version 4 by Geoscience Australia. It contains depth contours for -20m, -40m, -100m, -200m and -400m. Contours were generated in ArcMap using the Spatial Analyst Tools / Surface / Contour List tool. This output was then simplified using the Cartography Tools / Generalization / Smooth Line with a tolerance of 300m. The rest of this documentation is based on the metadata of the Australian bathymetry and topography grid itself. This grid is available from GA at http://dx.doi.org/10.4225/25/53D99B6581B9A . In 2005 Geoscience Australia and the National Oceans Office undertook a joint project to produce a consistent, high-quality 9 arc second (0.0025 deg or ~250m at the equator) bathymetric grid for Australian waters. In 2009 a number of new datasets were included in an updated version of the grid. The 2009 bathymetric grid of Australia has been produced to include recently acquired datasets, and solutions to issues identified in the previous version. The revised grid has the same extents as its 2005 counterpart, including the Australian water column jurisdiction lying between 92 deg E and 172 deg E, and 8 deg S and 60 deg S. The waters adjacent to the continent of Australia and Tasmania are included, as are areas surrounding Macquarie Island, and the Australian Territories of Norfolk Island, Christmas Island, and Cocos (Keeling) Islands. The area selected does not include Australia's marine jurisdiction offshore from the Territory of Heard and McDonald Islands and the Australian Antarctic Territory. This report details the datasets and procedures used to produce the 2009 bathymetric grid of Australia. As per the 2005 grid, the 0.0025 decimal degree (dd) resolution is only supported where direct bathymetric observations are sufficiently dense (e.g. where swath bathymetry data or digitised chart data exist) (Webster and Petkovic, 2005). In areas where no sounding data are available (in waters off the Australian shelf), the grid is based on the 2 arc minute ETOPO (Smith and Sandwell, 1997) and 1 arc minute ETOPO (Amante and Eakins, 2008) satellite derived bathymetry. The topographic data (on shore data) is based on the revised Australian 0.0025dd topography grid (Geoscience Australia, 2008), the 0.0025dd NZ topography grid (Geographx, 2008) and the 90m SRTM DEM (Jarvis et al, 2008). The final dataset has been provided in ESRI grid and ER Mapper (ers) formats. An associated shapefile has been produced so that the user can identify the input datasets that were used in the final grid. Data Location: This dataset is filed in the eAtlas enduring data repository at: data\other\AU_GA_Bathymetry-2009\derived\AU_e-Atlas-GA_Bathymetry-2009_Contours
-
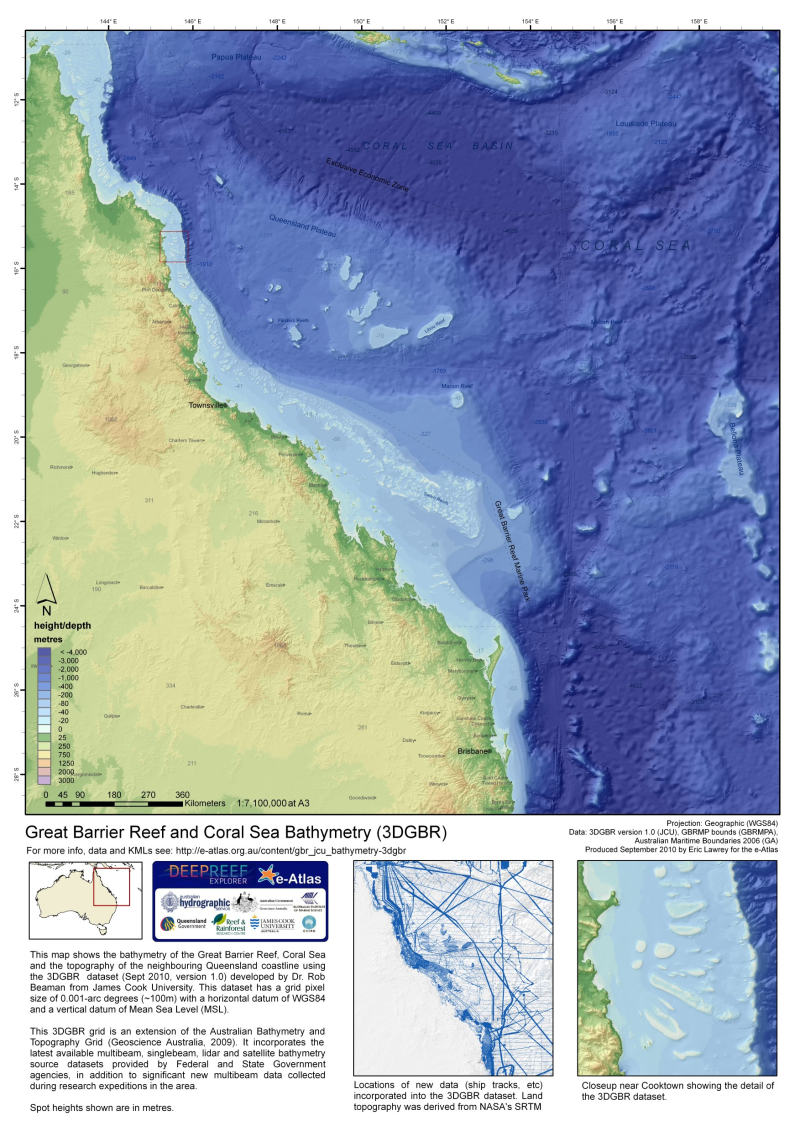
The gbr100 dataset is a high-resolution bathymetry and Digital Elevation Model (DEM) covering the Great Barrier Reef, Coral Sea and neighbouring Queensland coastline. This DEM has a grid pixel size of 0.001-arc degrees (~100m) with a horizontal datum of WGS84 and a vertical datum of Mean Sea Level (MSL). For the latest version of this dataset download the data from http://deepreef.org/bathymetry/65-3dgbr-bathy.html This dataset was developed as part of the 3DGBR project. This grid utilises the latest available multibeam, singlebeam, lidar and satellite bathymetry source datasets provided by Federal and State Government agencies, in addition to significant new multibeam data collected during research expeditions in the area. The large increase in source bathymetry data added much detail to improving the resolution of the current Australian Bathymetry and Topography Grid (Whiteway, 2009). The gbr100 grid provides new insights into the detailed geomorphic shape and spatial relationships between adjacent seabed features. The accompanying report contains an explanation of the various source datasets used in the development of the new grid, and how the data were treated in order to convert to a similar file format with common horizontal (WGS84) and vertical (mean sea level) datums. Descriptive statistics are presented to show the relative proportion of source data used in the new grid. The report continues with a detailed explanation of the pre-processing and gridding process methodology used to develop the grid. A description is also provided for additional spatial analysis on the new grid in order to derive associated grids and layers. The results section provides a short overview of the improvement of the new grid over the current Australian Bathymetry and Topography Grid (Whiteway, 2009). The report then presents the results of the new grid, called gbr100, and the associated derived map outputs as a series of figures. A table of metadata for the current source data accompanies this report as Appendix 1. The report is available at: http://www.deepreef.org/publications/reports/67-3dgbr-final.html Data details and format: gbr100 bathymetry grid: Height/Depth in metres (MSL) Formats: 19000x18000 pixel grid (32 bit float) in ESRI raster grid file, GMT/netCDF grid file, Fledermaus sd file, 100m contour ESRI shapefile, GeoTiff grid file. Total Vertical Uncertainty: Total Vertical Uncertainty (TVU) in the bathymetry estimated from uncertainty classification of each source dataset. Formats: 19000x18000 pixel grid (32 bit float) in ESRI raster, GeoTiff. Hillshading: Hillshading for full gbr100 and also ocean areas only. Derived from the gbr100 grid. Format: 19000x18000 pixel grid (8 bit) in GeoTiff. Funding history: This dataset was initially developed as part of project 2.5i.1 from the MTSRF program (2010). Subsequent versions of the dataset were developed from other funding sources. Version history: - July 2010 - Version 1 Initial release of the DEM. - Dec 2014 - Version 3 This version incorporates dozens of new bathymetric surveys including many new navy LADS surveys and some satellite derived bathy to fill in some gaps left by LADS. - Jan 2016 - Version 4 This version incorporates estimates of bathymetry from satellite imagery in shallow clear waters. - Nov 2020 - Version 6 This revised 3D depth model (V6 – 10 Nov 2020) is a significant improvement on the previous 2017 version, with all offshore reefs mapped with either airborne lidar bathymetry surveys or satellite derived bathymetry. All the available processed multibeam data are now included. Crowdsourced singlebeam bathymetry adds over 50 thousand line km of source data to the inter-reef seafloor. Work will continue to fill the gaps. Data Location: This dataset is filed in the eAtlas enduring data repository at: data\ongoing\GBR_JCU_Beaman_3DGBR-bathymetry-gbr100 Note: Copies of legacy versions 1, 3 and 4 are stored in the eAtlas and available on request. eAtlas Processing: To visualize this dataset on the eAtlas the format of the data was converted from the ESRI ArcInfo grid format into a GeoTiff format. This was done by loading the data in ArcMap then exporting it as a GeoTiff image. Overview images and final compression options were then performed using GDAL tools.
-
The eAtlas delivers its mapping products via two Web Mapping Services, a legacy server (from 2008-2011) and a newer primary server (2011+) to which all new content it added. This record describes the legacy WMS. This service was decommissioned on in Jan 2024. This service delivered map layers associated with the eAtlas project (https://eatlas.org.au), and contained map layers of environmental research focusing on the Great Barrier Reef. The majority of the layers corresponding to Glenn De'ath's interpolated maps of the GBR developed under the MTSRF program (2008-2010). This web map service was predominantly maintained for the no decommissioned legacy eAtlas map viewer (https://maps.eatlas.org.au/geoserver/www/map.html). This WMS service was implemented using GeoServer version 1.7 software hosted on a server at the Australian Institute of Marine Science. Note: this service had around 460 layers of which approximately half the layers correspond to Standard Error maps, which were WRONG (please ignore all *Std_Error layers). This services was operated by the Australian Institute of Marine Science and co-funded by the MTSRF program. More details about this service is described on the eAtlas Legacy System webpage https://eatlas.org.au/content/legacy-mapping-system
-
The eAtlas delivers its mapping products via two Web Mapping Services, a legacy server (from 2008-2011) and a newer primary server (2011+) to which all new content is added. This record describes the primary WMS. This service delivers map layers associated with the eAtlas project (https://eatlas.org.au), which contains map layers of environmental research focusing on the Great Barrier Reef and its neighbouring coast, the Wet Tropics rainforests and Torres Strait. It also includes lots of reference datasets that provide context for the research data. These reference datasets are sourced mostly from state and federal agencies. In addition to this a number of reference basemaps and associated layers are developed as part of the eAtlas and these are made available through this service. This services also delivers map layers associated with the Torres Strait eAtlas. This web map service is predominantly set up and maintained for delivery of visualisations through the eAtlas mapping portal (https://maps.eatlas.org.au) and the Australian Ocean Data Network (AODN) portal (http://portal.aodn.org.au). Other portals are free to use this service with attribution, provided you inform us with an email so we can let you know of any changes to the service. This WMS is implemented using GeoServer version 2.13 software hosted on a Amazon Web Services (AWS) server. Associated with each WMS layer is a corresponding cached tiled service which is much faster then the WMS. Please use the cached version when possible. The layers that are available can be discovered by inspecting the GetCapabilities document generated by the GeoServer. This XML document lists all the layers, their descriptions and available rendering styles. Most WMS clients should be able to read this document allowing easy access to all the layers from this service. For ArcMap use the following steps to add this service: 1. "Add Data" then choose GIS Servers from the "Look in" drop down. 2. Click "Add WMS Server" then set the URL to "https://maps.eatlas.org.au/maps/wms?" Note: this service has over 1500 layers and so retrieving the capabilities documents can take a while. This services is operated by the Australian Institute of Marine Science and co-funded by the National Environmental Research Program Tropical Ecosystems hub.
-
The eAtlas delivers its NetCDF (Network Common Data Form) data file using a THREDDS Data Server (TDS), which provides metadata and data access using OPeNDAP, OGC WMS and WCS, HTTP, and other remote data access protocols. The services delivers data, matadata and map layers associated with the eAtlas project (https://eatlas.org.au). The data focus on environmental research on the Great Barrier Reef and its neighbouring coast, the Wet Tropics rainforests and Torres Strait. The map layers served by the WMS service can be used to create environmental maps when combine with other dataset such as the layers provided by the eAtlas Web Mapping Service (https://eatlas.org.au/data/uuid/71127e4d-9f14-4c57-9845-1dce0b541d8d). This web map service is predominantly set up and maintained for delivery of visualisations through the eAtlas mapping portal (https://maps.eatlas.org.au). Other portals are free to use this service with attribution, provided you inform us with an email so we can let you know of any changes to the service. This THREDDS Data Server software is hosted on a Amazon Web Services (AWS) server. Associated with each NetCDF dataset, there is a list of corresponding WMS layers, one for each data variable, which can be discovered by inspecting the corresponding GetCapabilities document. This XML document lists all the layers, a short descriptions and available rendering styles. Most WMS clients should be able to read those documents allowing easy access to all the variables for a given NetCDF dataset. This services is operated by the Australian Institute of Marine Science and co-funded by the National Environmental Science Program Tropical Water Quality (NESP TWQ) Hub.