 eAtlas Data Catalogue
geoscientificInformation
Type of resources
Topics
Keywords
Contact for the resource
Provided by
Formats
Representation types
Update frequencies
status
Scale
-
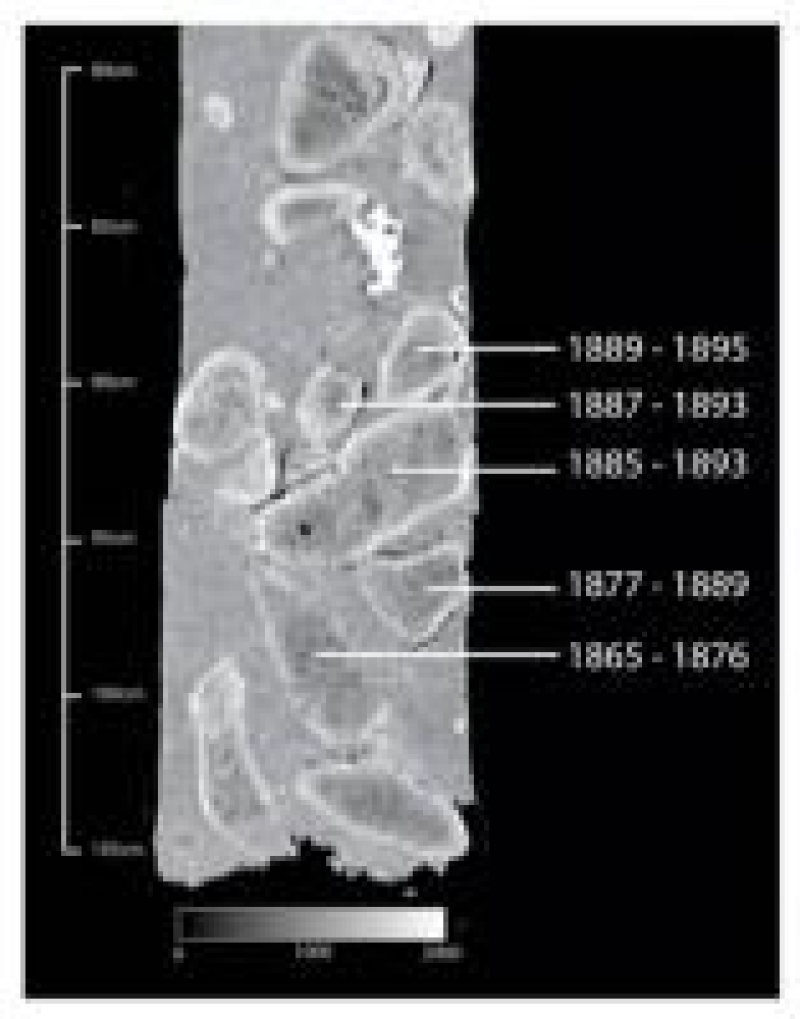
Trajectories of decline have been observed in coral reefs throughout the Caribbean and Indo-Pacific region attributable to the synergistic effects of human-induced disturbances. Whilst direct and indirect evidence suggests that inshore reefs from the Great Barrier Reef (GBR) are showing signs of regional decline following European settlement in the mid 18th century, it has proven difficult to ascertain the link between anthropogenic disturbance and coral degradation on a regional scale. This is primarily due to the absence of detailed ecological baselines on the past condition of many of these reefs prior to the advent of long-term monitoring in the mid 1980’s. An understanding of the timing, frequency, duration and cause of mortality events in hard coral communities is necessary to help direct management efforts towards ameliorating potential impacts. Furthermore, assessing the spatial and temporal variability of changes in community structure before and after European settlement, will provide an invaluable management tool to overcome the ‘shifting baseline’ syndrome. By dating and mapping historical changes in coral communities of inshore reefs of the GBR, the purpose of this study is to provide a detailed baseline assessment on coral community structure and an accurate chronology on the history and nature of mortality events. Dead coral skeletons have been dated using the highly-precise (2? ± up to 1 year) thermal ionisation mass spectrometry (TIMS) uranium-series (U-series) dating method in order to determine 1) the timing of historical mortality in coral communities and massive Porites corals in the Palm Islands region (central Inshore GBR) and reefs adjacent to catchments in the southern GBR (Mackay region) and far northern GBR, 2) historical patterns of storm occurrence on the offshore GBR (One Tree and Heron Reefs), and 3) Holocene sea level changes from the inshore GBR (Magnetic Island). So far, more than 320 samples have been dated at the Radiogenic Isotope Facility, University of Queensland. Our results have revealed shifts in coral community structure and a loss of previously dominant Acropora corals in the early 20th century in the Palm Islands region. It is theorized that this loss may be attributable to the synergistic impacts of declining water quality and climatic related factors. Analysis of uplifted reef blocks from the offshore GBR reveals a period of high storm activity throughout the 19th & 20th centuries. Furthermore, U-series dating of fossil massive corals from Magnetic Island suggests that sea level was higher than present around 2200 to 7000 years ago during the Holocene. Overall, our results show that U-series dating and palaeoecological approaches can provide unique insight into the GBR’s past. Data Units: U-series age (AD) ± 2-sigma error References: - Yu K. F. and Zhao J. X. (2010) U-series dates of Great Barrier Reef corals suggest at least +0.7 m sea level ~7000 years ago. The Holocene 20, 1-8. - Zhao J. X., Neil D. T., Feng Y. X., Yu K. F., and Pandolfi J. M. (2009) High-precision U-series dating of very young cyclone-transported coral reef blocks from Heron and Wistari reefs, southern Great Barrier Reef, Australia. Quaternary International 195, 122-127. - Zhao J. X., Yu K. F., and Feng Y. X. (2009) High-precision 238U-234U-230Th disequilibrium dating of the recent past - a review. Quaternary Geochronology 4, 423–433.
-
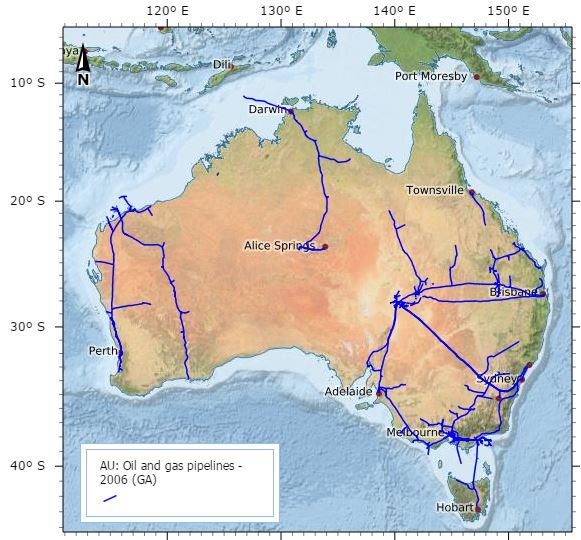
This data set contains information on Oil and Gas pipeline infrastructure. This dataset has been converted from Microstation format used in a map "Petroleum Exploration and Development Titles" published annually in APRIL. Attributes have been added to comply with data standards and minor coding of line work has been achieved using annotation from the map. Further data has been added, specifically for the specific Acreage Release Areas. This metadata was prepared for the North West Atlas and is not authoritative. Please contact the custodian for the latest authoritative version of this record.
-
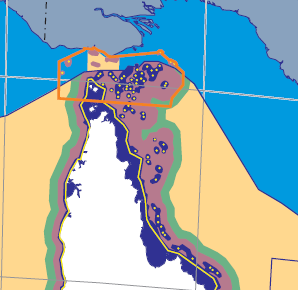
Geoscience Australia has the primary role in the delineation of Australia's maritime boundaries. An output of this activity is the development of the Australian Maritime Boundaries (AMB) data. AMB is a GIS data product, replacing AMBIS 2001 Version 1.1, providing access to the data for Australia's Territorial Sea Baseline (TSB) and maritime zones. Note: This is a non authoritative copy of the metadata for the use in the eAtlas. Please refer to Geoscience Australia for queries on this dataset. This version of the dataset is now superseded by the Seas and Submerged Lands Act 1973 - epoch AMB2014a dataset. AMB is a digital representation of Australia's territorial sea baseline and boundaries as established under the Seas and Submerged Lands Act 1973. The data also include a representation of the limits by which the adjacent areas of each of the States and of the Northern Territory are determined under the Petroleum (Submerged Lands) Act 1967. In the event of an inconsistency between AMB data and the baseline and limits under the legislation, the latter prevails. The data have been published by Geoscience Australia in consultation with other relevant Commonwealth Government agencies including the Attorney-General's Department, the Department of Foreign Affairs and Trade and the Australian Hydrographic Office. AMB data comprise the TSB and the outer limits of each zone, together with maritime boundaries determined by treaties between Australia and neighbouring countries. Base points that generate the zone boundaries are supplied in separate files and an extensive user guide provides useful background information. All data coordinates are supplied in the World Geodetic System (WGS 84) (ITRF 2000 @ 2000.0) which is effectively identical to the GDA94 datum. Geoscience Australia is committed to the maintenance of the maritime boundaries data to ensure it reflects the changing nature of Australia's coastline and hence the various maritime zone limits. The data reflects the location of the coastline within the constraints of available source material at the time of production. Where major differences have since been discovered, these are listed in a table of notes and cautions. Note: This is a non authoritative copy of the metadata for the use in the eAtlas. Please refer to Geoscience Australia for queries on this dataset.
-
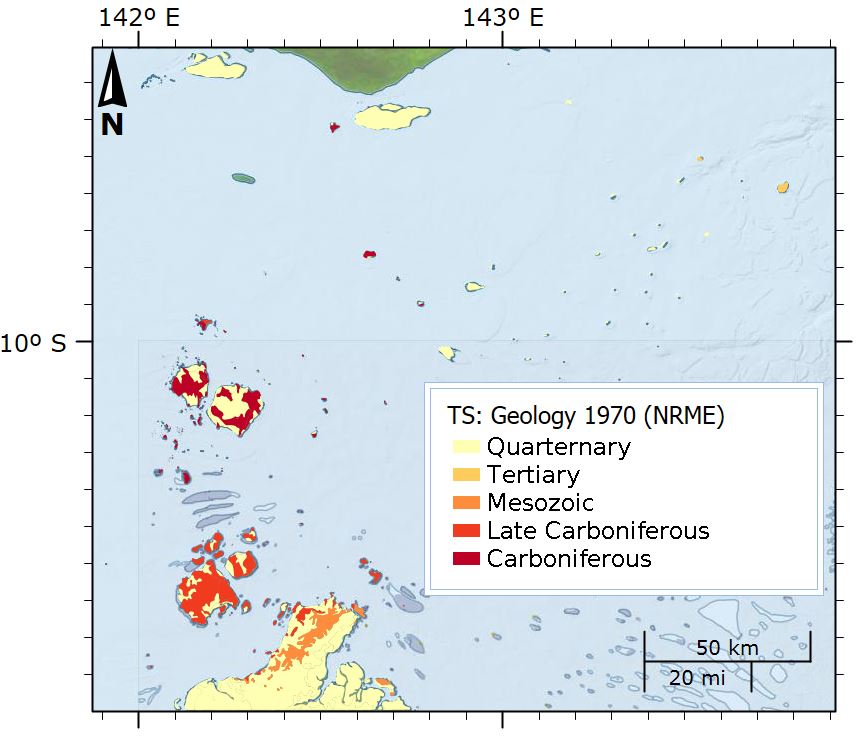
This dataset shows the geology of the Torres Strait region. The polygons in this dataset are a digital representation of the distribution or extent of geological units within the area. Polygons have a range of attributes including unit name, age, lithological description and an abbreviated symbol for use in labelling the polygons. These have been extracted from the Rock Units Table held in the Department of Natural Resources, Mines and Energy Merlin Database. The dataset was compiled in 1970 by WF Willmott (BMR), simplified from mapping in 1968 by DS Trail, WF Willmott, WD Palfreyman (B.M.R), WG Whitaker (G.S.Q.). The islands were mapped using two dinghies operating from a 45-foot chartered launch. Air photography was available for the islands, except for Stephens, Darnley, and Murray Islands, the shapes of which are consequently uncertain. For the Torres Strait Sheet geology was plotted on photoscale maps (1:50,000) made by the Royal Australian Survey Corps, and later reduced to 1:250,000 scale. For the Daru-Maer Island Sheet the geology was plotted directly at 1:250,000 scale. Data Format: Shapefile with 297 polygon features and has a range of attributes including unit name, age, lithological description and an abbreviated symbol for use in labelling the polygons. Definition source: The Rock Units Table held in the Department of Natural Resources, Mines and Energy Merlin Database. ROCK_U_NAM: The Map Unit Name of the polygon. In the case of named units it comprises of the standard binomial name. Unnamed subdivisions of named units include the binomial name with a letter symbol as a suffix. Unnamed units are represented by a letter symbol, usually in combination with a map sheet number. AGE:Geological age of unit (Quarternary, Tertiary, Mesozoic, Late Carboniferous, Carboniferous) LITH_SUMMA: Provides a brief description of the map units as they have been described in the course of the project work, or as has appeared on relevant hard copy map legends. * Basalt lava and tuff * Coastal marine deposits: saltpans, mangrove swamps, lagoonal deposits; sand, mud * Clay, silt, sand, gravel; flood plain alluvium * Leucocratic and porphyritic biotite granite, hornblende-biotite adamellite, granodiorite * Rhyolitic welded tuff, rhyolite, agglomerate, volcanic breccia, andesite, siltstone, arenite * Porphyry * Residual and colluvial soil, sand, gravel, rubble, some semi-consolidated material * Lithics and crystal-rich rhyolitic ignimbrite; volcanic rudite and breccia; rhyolite; andesite; some volcaniclastic sedimentary rocks * Lithics and crystal-rich dacitic to rhyodacitic ignimbrite; tuffaceous siltstone, sandstone * Crystal-rich rhyolitic ignimbrite; rhyolite; volcaniclastic rudite * Sandstone, conglomerate and shale * Younger dune sand and some minor older dune sand with dune ridges ROCK_U_TYP: Provides a means of separating map units, eg for constructing a map reference. This item will contain one of the following: * STRAT- Stratigraphic unit, including sedimentary, volcanic and metamorphic rock units. * INTRU- Intrusive rock units; * COMPST- Compound unit where the polygon includes two or more rock units, either stratigraphic, intrusive or both; * COMPST- Compound unit, as above where the dominant or topmost unit is of the STRAT type; * COMPIN- Compound unit, as above, where the dominant unit is of the INTRU type; * WATER- Water bodies- Large dams, lakes, waterholes. SEQUENCE_N: A numeric field to allow sorting of the rock units in approximate stratigraphic order as they would appear on a map legend. DOMINANT_R: A simplified lithological description to allow generation of thematic maps based on broad rock types. * BASALT * MISCELLANEOUS UNCONSOLIDATED SEDIMENTS * ALLUVIUM * GRANITOID * FELSITES (LAVAS, CLASTICS & HIGH-LEVEL INTRUSIVES) * COLLUVIUM * SEDIMENTARY ROCK * SAND MAP_SYMBOL: Provides an abbreviated label for polygons. Mostly based on the letter symbols as they appear on published maps or the original hard copy compilation sheets. These are not unique across the State, but should be unique within a single map tile, and usually adjacent tiles.
-
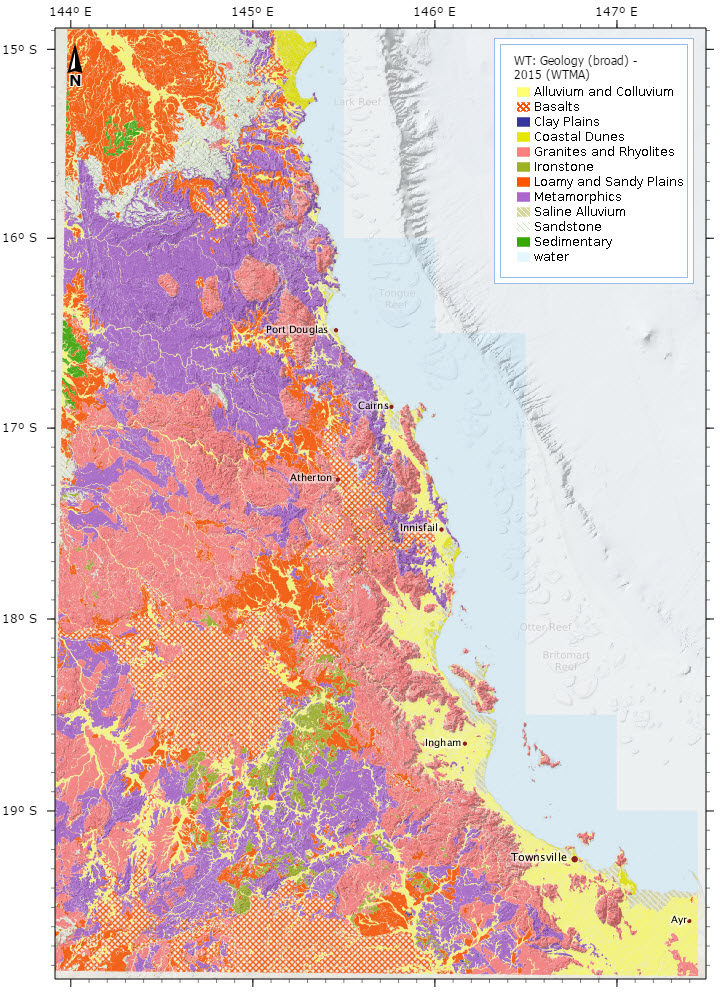
This dataset shows the broad geology of the Wet Tropics of Queensland and surrounding areas from Ayr up to north of Cooktown. It is a combination of the "Geology of the Wet Tropics Bioregion (WTMA)" dataset (WtmaGeology) from the Vegetation mapping of the Wet Tropics and the state wide Regional Ecosystem mapping by the Queensland Government. Whilst the WtmaGeology dataset provided high resolution mapping of geology in the Wet Tropics Bioregion it only provided geology where there was remnant vegetation. As a result cleared and regrowth areas were not assigned a geology type. This dataset resolves this problem by filling in these areas with geology information extracted from the Regional Ecosystem mapping. In addition to this the Regional Ecosystem mapping data was used to expand the coverage outside the Wet Tropics Bioregion to provide a continuity with the adjoining Bioregions. To maintain compatibility compatibility between the two sources of mapping some of the WtmaGeology classifications were grouped. As a result this dataset has broader classifications then the WtmaGeology dataset. The geology in this dataset has the following classifications: Geology - Landzone * Saline Alluvium - 1 * Coastal Dunes- 2 * Alluvium and Colluvium - 3 * Clay Plains - 4 * Loamy and Sandy Plains - 5 * Ironstone - 7 * Basalts - 8 * Sedimentary - 9 * Sandstone - 10 * Metamorphics - 11 * Granites and Rhyolites - 12 * water More information about each of the geology classifications can be found in the Land Zone descriptions - https://www.qld.gov.au/environment/plants-animals/plants/ecosystems/land-zones/. The geology from the Regional Ecosystem mapping was extracted using the following process. The Landzone was extracted from the Pre-clearing regional ecosystems mapping; thence the Broad Geology was determined from the Landzone descriptions - General term. General term was kept consistent as possible with the geology descriptors in the WtmaGeology coverage. The major discrepancies would be for geology described outside of the Bioregion of the Wet Tropics, such as Desert Uplands or Brigalow Belt. Background information on the Regional Ecosystem source data: Pre-clearing regional ecosystems mapping was developed at a map scale of 1:100,000 and 1:50,000 the in the Bioregion of the Wet Tropics, based on surveys of vegetation communities and related landform, soils and geology and on 1:80,000 B&W 1960-1993 aerial photography. The survey and mapping of regional ecosystems of Queensland provides information for regional groups, non-government organisations, government departments, local government and industry, for planning and management purposes. (Dataset for Queensland incomplete). The major discrepancies would be for geology described outside of the Bioregion of the Wet Tropics, such as Desert Uplands or Brigalow Belt. The pre-clearing mapping is based on aerial photography and field survey of vegetation communities. Regional ecosystem linework reproduced at a scale greater than 1:100,000, except in designated areas, should be used as a guide only. Version 7.0 regional ecosystem descriptions, as originally described in Sattler & Williams (ed.) (1999) is available for download on the website: http://www.ehp.qld.gov.au/ecosystems/biodiversity/regional -ecosystems/how_to_download_redd.html (Regional Ecosystem Description Database). Format: This dataset is available in two formats: a ArcGIS Shapefile (249 MB) and and ArcGIS File Geodatabase (100 MB).