 eAtlas Data Catalogue
society
Type of resources
Available actions
Topics
Keywords
Contact for the resource
Provided by
Years
Formats
Representation types
Update frequencies
status
-
This dataset contains responses from line (n=53), charter (n=40), and trawl (n=21) fishers to a face-to-face survey about the impacts of the 2004 rezoning of the GBR on commercial fishing activity and commercial fishers. Data Units: Quantitative data about fishers attitudes, perceptions, and opinions about the 2004 zoning plan plus spatial data regarding pre- and post-rezoning locations used by fishers.
-
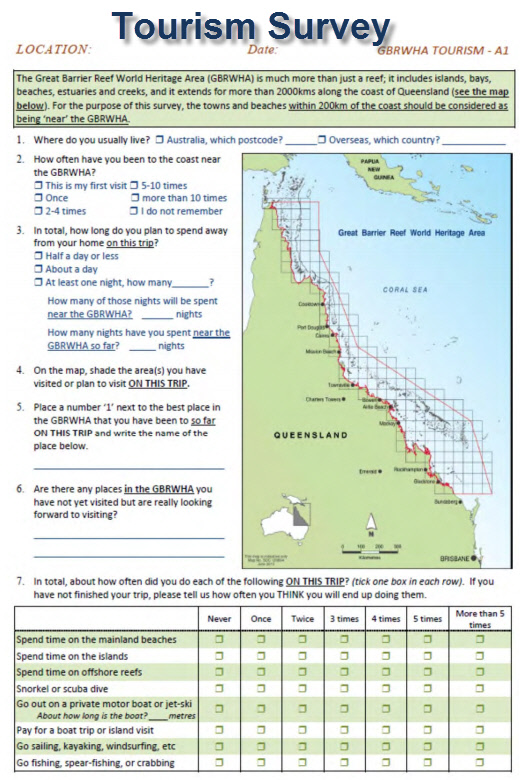
This dataset represents the aggregate of face to face surveys of 2743 visitors to the Great Barrier Reef World Heritage Area (GBRWHA) conducted in quarterly periods from June 2012 to June 2013. This survey was to explore how tourists feel towards and perceive Great Barrier Reef World Heritage Area, as well as their willingness to pay to protect the reef and their satisfaction with current and future developments in and around the GBRWHA. Due to privacy constrains this dataset does not correspond to the raw survey results, but instead is an aggregate of views of tourists from different origins. The format of the data is an Excel spreadsheet. The core segments of the tourist questionnaire included questions about: * The socio-demographic background of respondents PLUS background about travel party and origin * How often visitors had been to the GBRWHA in the past and what they did (or planned to do) while on this particular trip * Questions about the importance of various ‘goods and services’ to their overall decision to come to the region (in contrast to the resident survey which asked about importance to overall quality of life). * Their satisfaction with the trip overall (in contrast to the resident survey which asked about satisfaction with life overall) * The way in which their decision to come to the region would have been affected by changes in various environmental and market factors (in contrast to the resident survey which asked about the way these things would affect overall quality of life). * Expenditure while in the area * Willingness to pay for improvements in various environmental attributes This tourist survey was developed in combination with a matching resident questionnaire. Data was collected from visitors to the GBRWHA region in 59 location along the coast from airports, ferry/boat operators, caravan-park owners and beach / lagoon areas in Cairns, Port Douglas, Townsville, Bowen, Airlie Beach, Rockhampton and Yeppoon. Enumerators collected data using a questionnaire specifically developed for the purpose of the project. Questionnaires were also available in Japanese and Chinese, with the presence of Japanese and Chinese speaking enumerators. Data collection occurred in 4 time periods over the June 2012 to June 2013 year, to account for seasonality of the tourist visitations. In addition to this data was collected from a stratified random selection of tourism operators between Cooktown and Gladstone. From an initial list of 673 tourism operators they were divided into the accomodation sector, tour operators and tourism 'attractions'. In total 36 operators agreed to participate and resulted in 203 completed surveys. In line with the national Ethical Conduct in Human Research guidelines and JCU Ethics Committee Approval for this research, raw data collected from individuals cannot be made publically available. Rather, data is collated into meaningful units and presented as such. This dataset is accompanied by the following factsheets in pdf format: 1. Activities and Preferences of Visitors to the Great Barrier Reef World Heritage Area 2. Activities and Preferences of Visitors to Townsville and Airlie Beach 3. Activities and Preferences of Visitors to Gladstone to Mackay region 4. Activities and Preferences of Visitors to Tropical NQ 5. Activities and Preferences of Chinese Visitors to Tropical NQ 6. Activities and Preferences of Japanese Visitors to Tropical NQ 7. Activities and Preferences of Queensland Visitors to Tropical NQ 8. Activities and Preferences of Domestic (non-QLD) Visitors to Tropical NQ. The data associated with this metadata record corresponds to an Excel data sheet containing the aggregate data used in the accompanying summary PDF fact sheets. Further details of the project, including data collection and analysis methods, can be found in: Stoeckl, N., Farr, M. and Sakata H. (2013) What do residents and tourists ‘value’ most in the GBRWHA? Project 10.2 interim report on residential and tourist data collection activities including descriptive data summaries. Report to the National Environmental research program. Reef and Rainforest Research Centre Limited, Cairn (pp112) Available online from: http://www.nerptropical.edu.au/research
-
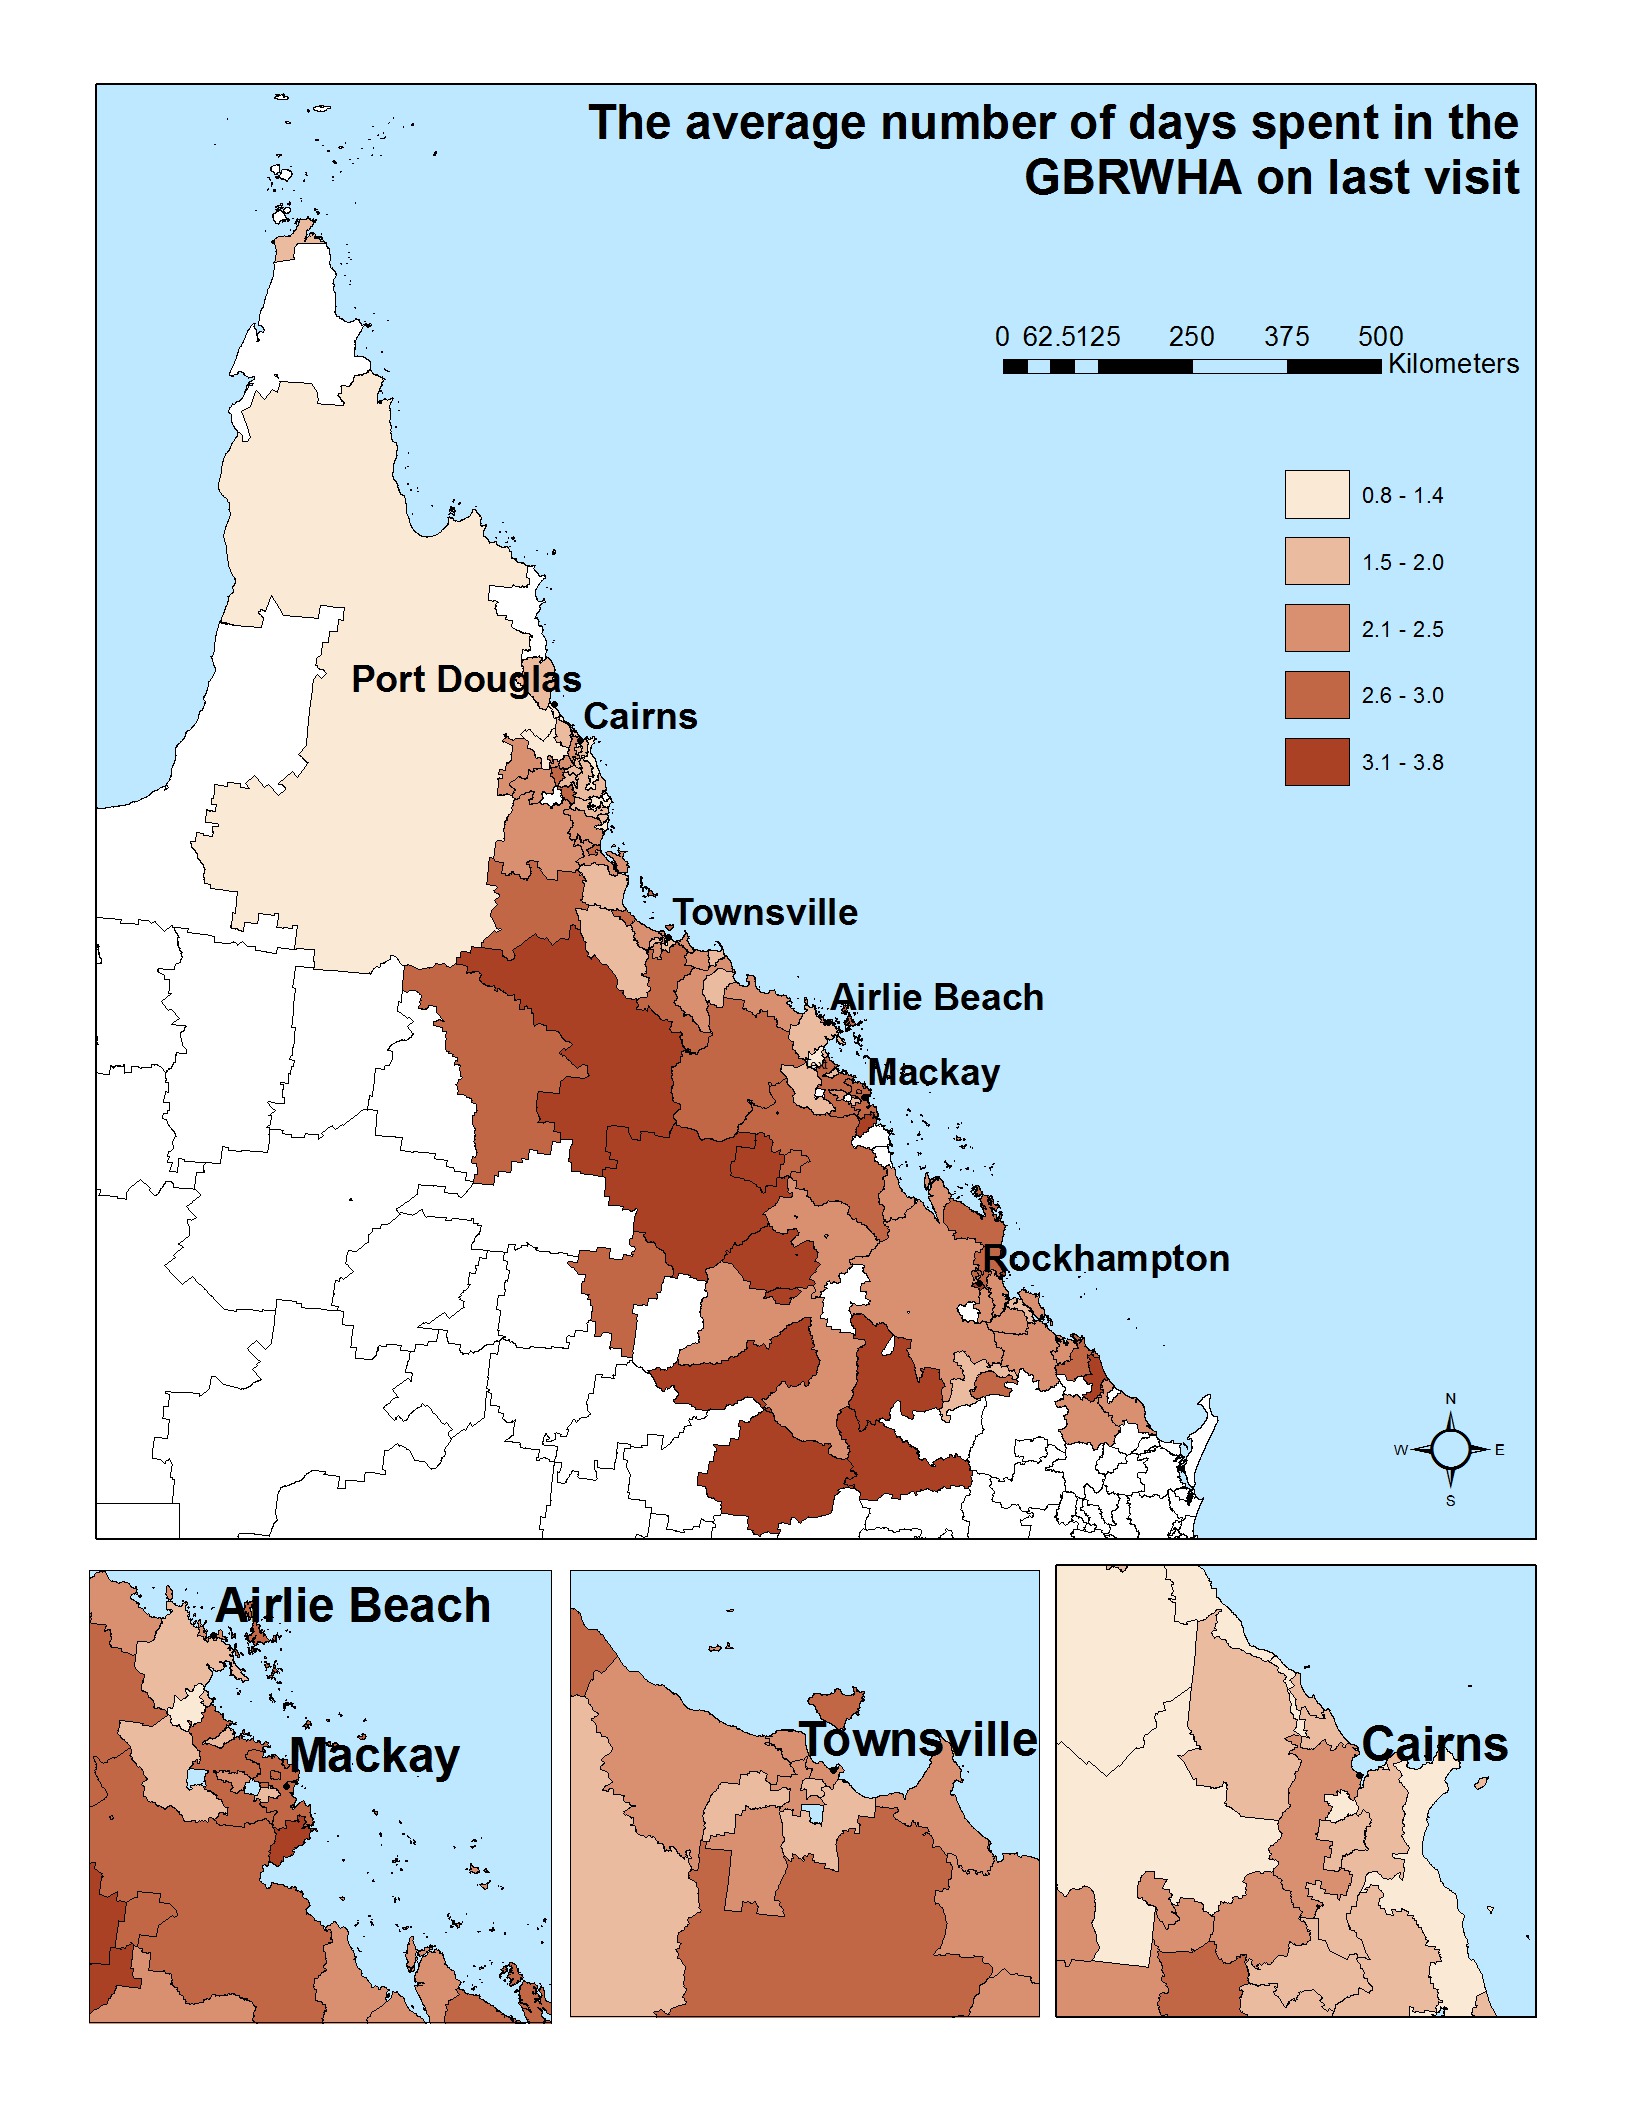
This data set in excel sheet format presents results of the mail survey of 1565 residents of the GBRWHA. The dataset is accompanied by a set of 58 maps that illustrate key findings. Project 10.2 explored how visitors and residents feel towards and perceive Great Barrier Reef World Heritage Area, as well as their willingness to pay to protect the reef and their satisfaction with current and future developments in and around the GBRWHA. Data were collected from the residents of the GBRWHA using a mail-out survey to a geographically stratified random sample of resident households in postcodes that lay partially or entirely within the study area. The pilot stage included 230 randomly selected households (2 from each of the postcodes identified), while the main mailing included about 40 households in each postcode. Following the Dilman (2007) methodology, we sent a reminder letter with replacement questionnaire to those who had not responded four weeks later, with a third reminder after that. We estimate that just under 4,000 questionnaires reached their intended recipients, and we received 902 completed questionnaires. We were cognizant that some demographic groups are more likely to respond to mail-out surveys than others in these regions (e.g. young males, Indigenous people). Therefore we conducted supplementary face-to-face data-collection using the same questionnaire, across various public locations such as ferry terminals, airports and beaches. These extra activities generated an additional 663 responses, bringing the total number of completed resident questionnaires to 1565. Data Format: Excel data sheet with each row representing a postcode within the Great Barrier Reef Catchment Area and each column providing summary information about one variable (e.g. % or respondents who have never been to the GBRWHA). The GIS maps represent the data visually (one variable per map, showing responses for each postcode). The original raw data cannot be published for privacy reasons. Data available here is a public form of the data, aggregated by postcode. Further details of the project, including data collection and analysis methods, can be found in: Stoeckl, N., Farr, M. and Sakata H. (2013) What do residents and tourists ‘value’ most in the GBRWHA? Project 10.2 interim report on residential and tourist data collection activities including descriptive data summaries. Report to the National Environmental research program. Reef and Rainforest Research Centre Limited, Cairn (pp112)
-
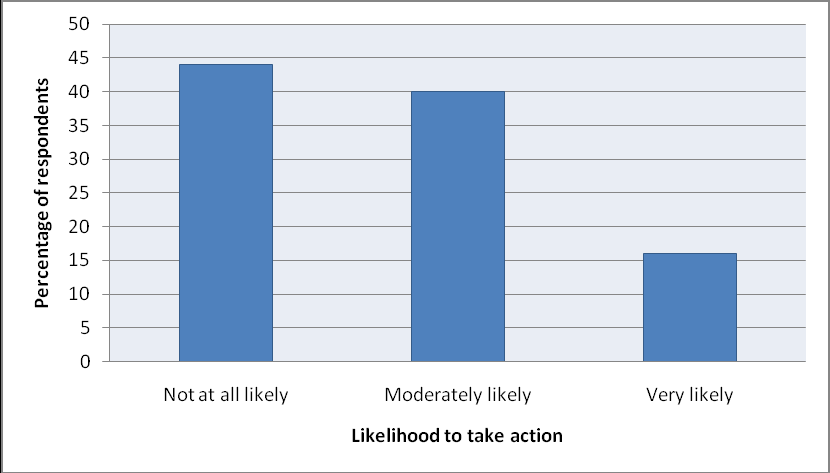
This dataset provides information about the Australian community's awareness, concern and actions regarding climate change and the GBR. It was aimed at providing a tool for developing effective engagement strategies and future climate change human dimensions research. The dataset contains data from 1,609 telephone surveys of people residing adjacent to the GBR and in the capital cities of Brisbane, Melbourne, and Sydney conducted in November 2008. Data Units: Quantitative data regarding Australian residents' attitudes, perceptions, knowledge, and concern about climate change and the GBR.
-
Long-term social and economic monitoring helps reef managers understand the current status of marine park users, industries and communities. It also helps build a picture of how industries and communities are likely to respond and cope with changes associated with environmental degradation, climate change, regulatory frameworks, and changes in culture. It can also assist in evaluating the effectiveness of management interventions.This project will establish and collect a unique data set that documents long-term social and economic trends in communities and users of the Great Barrier Reef (GBR). In 2011-12 a number of existing datasets were collated and relevant information extracted. Additionally data gaps were identified, which then formed the primary survey questions. In 2012-13 and 2013-14 primary data will be collected via surveys conducted on mini iPads from Bundaberg to Cooktown. Outcomes of this project include: * Providing GBR management and industries with better access to social and economic information necessary for planning purposes. * Strong liaison with GBR stakeholders on the social and economic status of the region. * An annual snapshot of the social and economic indicators for the entire GBR region.
-
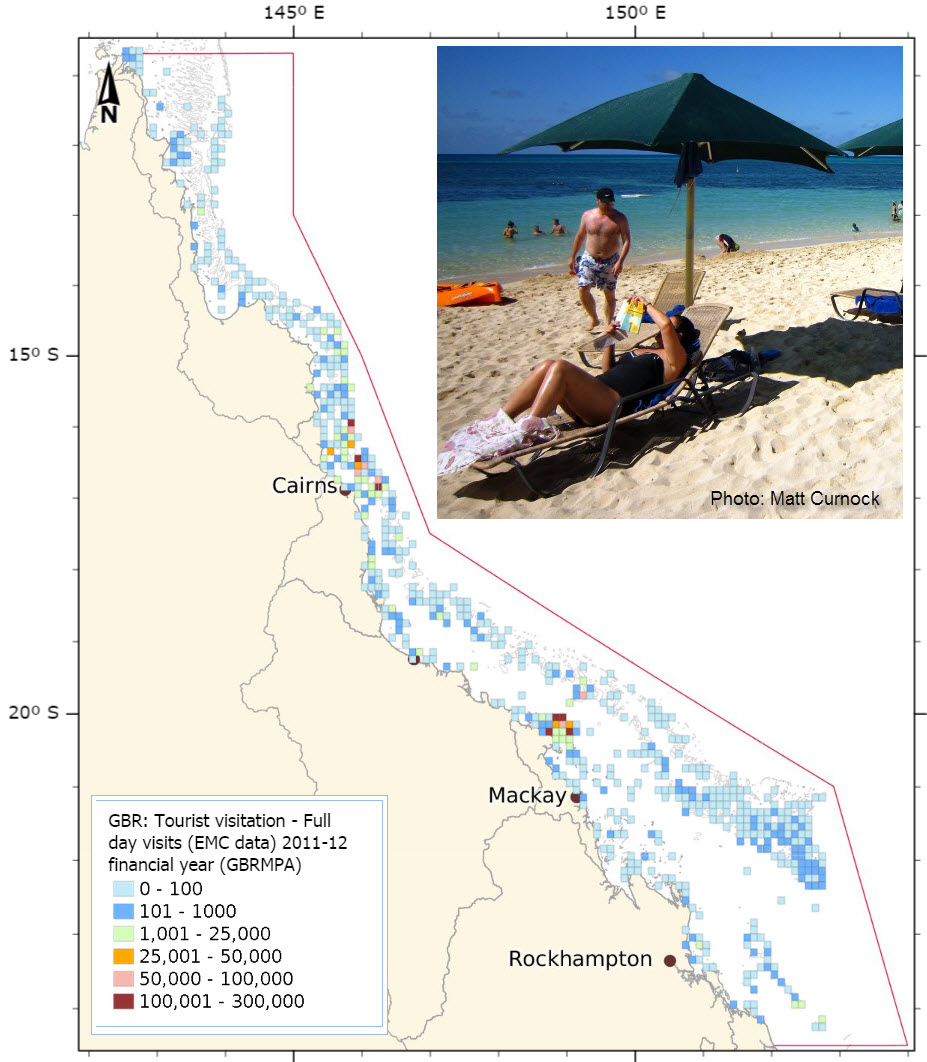
This dataset shows the spatial distribution of the number of visitors to the Great Barrier Reef Marine Park based on visitation rates collected from the Environmental Management Charge (EMC) managed by GBRMPA. The spatial information has been quantised into a 0.1 degree grid size. This data only represents visitors to the Great Barrier Reef who used commercial tourist operations. Data is collected and updated quarterly following receipt of Environmental Management Charge returns from tourism operators. This dataset is a set of annual snapshots of this monthly data. The count of visitor days to the Marine Park is calculated where passengers undertake a visit as follows: Full day visits: A day trip of more than three hours is recorded as a full day visit. Overnight trips are recorded as multiple full days, for example, a stay of two-days and one night is counted as two full day visits. Part day visits: Where the trip is less than three hours. The first day of a trip entering the Marine Park after 5 pm. The last day of a trip leaving the Marine Park before 6 am. Exempt visits are passengers who are not required to pay the Environmental Management Charge (EMC), for example: young children who are free-of-charge, trade familiarisation passengers who are free-of-charge, passengers for whom another operator has already paid EMC on that day and the fourth and subsequent days for passengers on extended charters. This metadata is not authoritative and was developed for documenting layers on the eAtlas. This dataset was supplied by the SELTMP team (http://seltmp.eatlas.org.au). Please contact the SELTMP of GBRMPA for further information. Format: This dataset consists of two shapefiles, one for the 2010-2011 financial year and one for the 2011-2012 financial year.
-
This dataset consists of three data folders including all related documents of the online survey conducted within the NESP 3.2.3 project (Tropical Water Quality Hub) and a survey format document representing how the survey was designed. Apart from participants’ demographic information, the survey consists of three sections: conjoint analysis, picture rating and open question. Correspondent outcome of these three sections are downloaded from Qualtrics website and used for three different data analysis processes. Related data to the first section “conjoint analysis” is saved in the Conjoint analysis folder which contains two sub-folders. The first one includes a plan file of SAV. Format representing the design suggestion by SPSS orthogonal analysis for testing beauty factors and 9 photoshoped pictures used in the survey. The second (i.e. Final results) contains 1 SAV. file named “data1” which is the imported results of conjoint analysis section in SPSS, 1 SPS. file named “Syntax1” representing the code used to run conjoint analysis, 2 SAV. files as the output of conjoint analysis by SPSS, and 1 SPV file named “Final output” showing results of further data analysis by SPSS on the basis of utility and importance data. Related data to the second section “Picture rating” is saved into Picture rating folder including two subfolders. One subfolder contains 2500 pictures of Great Barrier Reef used in the rating survey section. These pictures are organised by named and stored in two folders named as “Survey Part 1” and “Survey Part 2” which are correspondent with two parts of the rating survey sections. The other subfolder “Rating results” consist of one XLSX. file representing survey results downloaded from Qualtric website. Finally, related data to the open question is saved in “Open question” folder. It contains one csv. file and one PDF. file recording participants’ answers to the open question as well as one PNG. file representing a screenshot of Leximancer analysis outcome. Methods: This dataset resulted from the input and output of an online survey regarding how people assess the beauty of Great Barrier Reef. This survey was designed for multiple purposes including three main sections: (1) conjoint analysis (ranking 9 photoshopped pictures to determine the relative importance weights of beauty attributes), (2) picture rating (2500 pictures to be rated) and (3) open question on the factors that makes a picture of the Great Barrier Reef beautiful in participants’ opinion (determining beauty factors from tourist perspective). Pictures used in this survey were downloaded from public sources such as websites of the Tourism and Events Queensland and Tropical Tourism North Queensland as well as tourist sharing sources (i.e. Flickr). Flickr pictures were downloaded using the key words “Great Barrier Reef”. About 10,000 pictures were downloaded in August and September 2017. 2,500 pictures were then selected based on several research criteria: (1) underwater pictures of GBR, (2) without humans, (3) viewed from 1-2 metres from objects and (4) of high resolution. The survey was created on Qualtrics website and launched on 4th October 2017 using Qualtrics survey service. Each participant rated 50 pictures randomly selected from the pool of 2500 survey pictures. 772 survey completions were recorded and 705 questionnaires were eligible for data analysis after filtering unqualified questionnaires. Conjoint analysis data was imported to IBM SPSS using SAV. format and the output was saved using SPV. format. Automatic aesthetic rating of 2500 Great Barrier Reef pictures –all these pictures are rated (1 – 10 scale) by at least 10 participants and this dataset was saved in a XLSX. file which is used to train and test an Artificial Intelligence (AI)-based system recognising and assessing the beauty of natural scenes. Answers of the open-question were saved in a XLSX. file and a PDF. file to be employed for theme analysis by Leximancer software. Further information can be found in the following publication: Becken, S., Connolly R., Stantic B., Scott N., Mandal R., Le D., (2018), Monitoring aesthetic value of the Great Barrier Reef by using innovative technologies and artificial intelligence, Griffith Institute for Tourism Research Report No 15. Format: The Online survey dataset includes one PDF file representing the survey format with all sections and questions. It also contains three subfolders, each has multiple files. The subfolder of Conjoint analysis contains an image of the 9 JPG. Pictures, 1 SAV. format file for the Orthoplan subroutine outcome and 5 outcome documents (i.e. 3 SAV. files, 1 SPS. file, 1 SPV. file). The subfolder of Picture rating contains a capture of the 2500 pictures used in the survey, 1 excel file for rating results. The subfolder of Open question includes 1 CSV. file, 1 PDF. file representing participants’ answers and one PNG. file for the analysis outcome. Data Dictionary: Card 1: Picture design option number 1 suggested by SPSS orthogonal analysis. Importance value: The relative importance weight of each beauty attribute calculated by SPSS conjoint analysis. Utility: Score reflecting influential valence and degree of each beauty attribute on beauty score. Syntax: Code used to run conjoint analysis by SPSS Leximancer: Specialised software for qualitative data analysis. Concept map: A map showing the relationship between concepts identified Q1_1: Beauty score of the picture Q1_1 by the correspondent participant (i.e. survey part 1) Q2.1_1: Beauty score of the picture Q2.1_1 by the correspondent participant (i.e. survey part 2) Conjoint _1: Ranking of the picture 1 designed for conjoint analysis by the correspondent participant References: Becken, S., Connolly R., Stantic B., Scott N., Mandal R., Le D., (2018), Monitoring aesthetic value of the Great Barrier Reef by using innovative technologies and artificial intelligence, Griffith Institute for Tourism Research Report No 15. Data Location: This dataset is filed in the eAtlas enduring data repository at: data\nesp3\3.2.3_Aesthetic-value-GBR
-
The low-lying islands of the Torres Strait are vulnerable to climate change and the region faces a range of pressures including a growing population, future climate change, potential pollution as a result of rapid mining and resources development in Papua New Guinea, and increased shipping. Through participatory scenario planning with Torres Strait and PNG communities and stakeholders, informed by integrated ecosystem and climate modelling this project will identify ‘best bet’ strategies to protect livelihoods and achieve sustainable economic development. Tasks include: 1. Identification of key drivers influencing future livelihood pathways in the Torres Strait region. 2. Plausible future scenarios of livelihoods. 3. An agreed typology of livelihoods in the Torres Strait region. 4. An assessment of the adaptive capacity of livelihoods and communities. 5. An assessment of the potential future impacts from drivers on ecosystem services underpinning livelihoods. 6. Identification of the most vulnerable communities and potential case studies for Stage 2 7. Adaptation strategies for these communities. 8. A workshop report summarizing the above for dissemination to all participants.
-
This project focuses on relationships between socio-economic systems and the Great Barrier Reef (GBR). It comprises three interrelated activities to investigate: 1. Resident and tourist views about the relative ‘value’ of key ecosystem services that are provided by the reef. Researchers will design, distribute and analyse the results of a survey instrument to assess the relative value of different goods and services produced by the GBR to stakeholder groups using both traditional money-based valuation techniques and Larson’s non-monetary based technique. 2. Tourist views about the relative value of key attributes of reef health, and the likely consequence if reef health deteriorates such as fewer visits and less expenditure. 3. Researchers will develop proxies for rainfall, water quality, land use and economy at the catchment scale. Analyses of these data will be used to determine the extent to which variations in beef prices, the exchange rate and other socio-economic variables (in conjunction with biophysical variables) influence water quality in the GBR lagoon.
-
This dataset presents the raw data obtained from 1415 online and representative Australian that were asked to aesthetically rate 180 photos of typical coral reef landscapes. Mean aesthetic ratings of 180 photos were collected from the survey, as well as from an expert research team, contributing mean ratings of coral reef health, coral cover, coral pattern, coral topography, fish abundance, and visibility. Please note that CSIRO have published a version of this dataset on 29 May 2019, which should be considered the primary source of data information (i.e. citation for data files found on the CSIRO Portal). The published eAtlas version includes files supplied by the project to the eAtlas for publication. The eAtlas version differs in format (RatingsAesthetics.csv - includes the photo mean score) and includes a second spreadsheet containing information not available in the CSIRO version (Ratings-All.csv) which captures each photo's ratings against five factors (coral health, coral cover, coral topography, fish abundance and visibility), as outlined in point two below. The CSIRO version contains the SPSS data extract and codebook (xlsx file), as well as the photo ratings summary (PhotoRatingsInd.xlsx) without the calculated mean. Methods: 1. A survey was constructed to collect simple demographic information about each participant, the self-rated level of interest in coral reefs, and aesthetic ratings for each photo on a scale of 1-10 (where 1=extremely unattractive, and 10=extremely attractive). Once an individual agreed to partake in the survey, they were sent a survey with 50 photographs randomly chosen from the pool of 181 photographs. It was noted that the quality of responses could be affected if more than 50 photos were viewed (where 50 photos represented a ten-minute survey). The style of the survey was not dissimilar from very popular online games in which individuals are asked to rank aesthetic preferences of fashion or interior design items. A full list of the images used in the survey is available in Appendix 1 (1-90) A total of 1,417 individuals participated in the study, where each photo was rated at least 380 times on the ten-point scale. Twenty-nine percent of the sample came from Queensland, and 71% were distributed across Australia. Some 62.3% of people came from Metropolitan Australia, whilst 37.7 came from rural/regional Australia. Some 51.4% were female. Participants represented a range of experiences with the Great Barrier Reef, where 7.2% had never visited, and 7.9% did not find coral reefs that interesting. Most participants (99.6%) were not part of a GBR based club or community groups, such as a spear-fishing club. The average age for the sample population was 46.96 (standard error=0.471), and ranged from 16 to 89. 2. We identified 180 underwater coral reef photographs from those that were publicly available (www.gbrmpa.gov.au) or existed in the combined image libraries of the study authors. They represented typical underwater images from the GBR, with a common oblique perspective taken from approximately 5-10 m above a coral substrate. This perspective characterised the image that a person would see as soon as they placed their head beneath the water, and it was similar to the visual perspective used in monitoring surveys conducted by manta-towing at the Australian Institute of Marine Science. Some photos were duplicated and placed randomly, and some were modified using photo editing software to manipulate one feature independent of others, for the purposes of ‘checking’ the consistency and subtleties associated with making aesthetic judgements. Each photo was rated for each of the five factors (on a scale of low, medium, high) by members of the research team with experience in coral reefs; coral health, coral cover, coral topography, fish abundance, and visibility. Given that there were insufficient photos representing abundant fish and poor visibility, a total of 20 photos were manipulated to enhance or de-emphasise certain factors. These photos ensured that we could attribute differences in aesthetic appeal of each photo to at least one of the five factors. The final set of photos represented realistic coral reef images across all five factors, with a greater representation of images containing moderately high coral cover to capture the nuances across the scale of potential ratings and also to aide engagement during online rating sessions Format: This dataset consists of two CSV files and two PDF files. The two CSV files contain the data on aesthetic ratings from an online survey, and ratings on reef health and abundance. eAtlas Note: The original files were provided as Excel spreadsheet tables and were converted to CSV files. Photographs and analysis were originally supplied as word document files and have been converted to PDF files. References: Marshall, N.A., Marshall, P.A., and Smith, A.K. (2017) Managing for Aesthetic Values in the Great Barrier Reef: Identifying indicators and linking Reef Aesthetics with Reef Health. Report to the National Environmental Science Programme. Reef and Rainforest Research Centre Limited, Cairns (102 pp.). Data Location: This dataset is filed in the eAtlas enduring data repository at: eAtlas/nesp3/3.2.4_Defining-assessing-GBR-aesthetics