eAtlas Data Catalogue
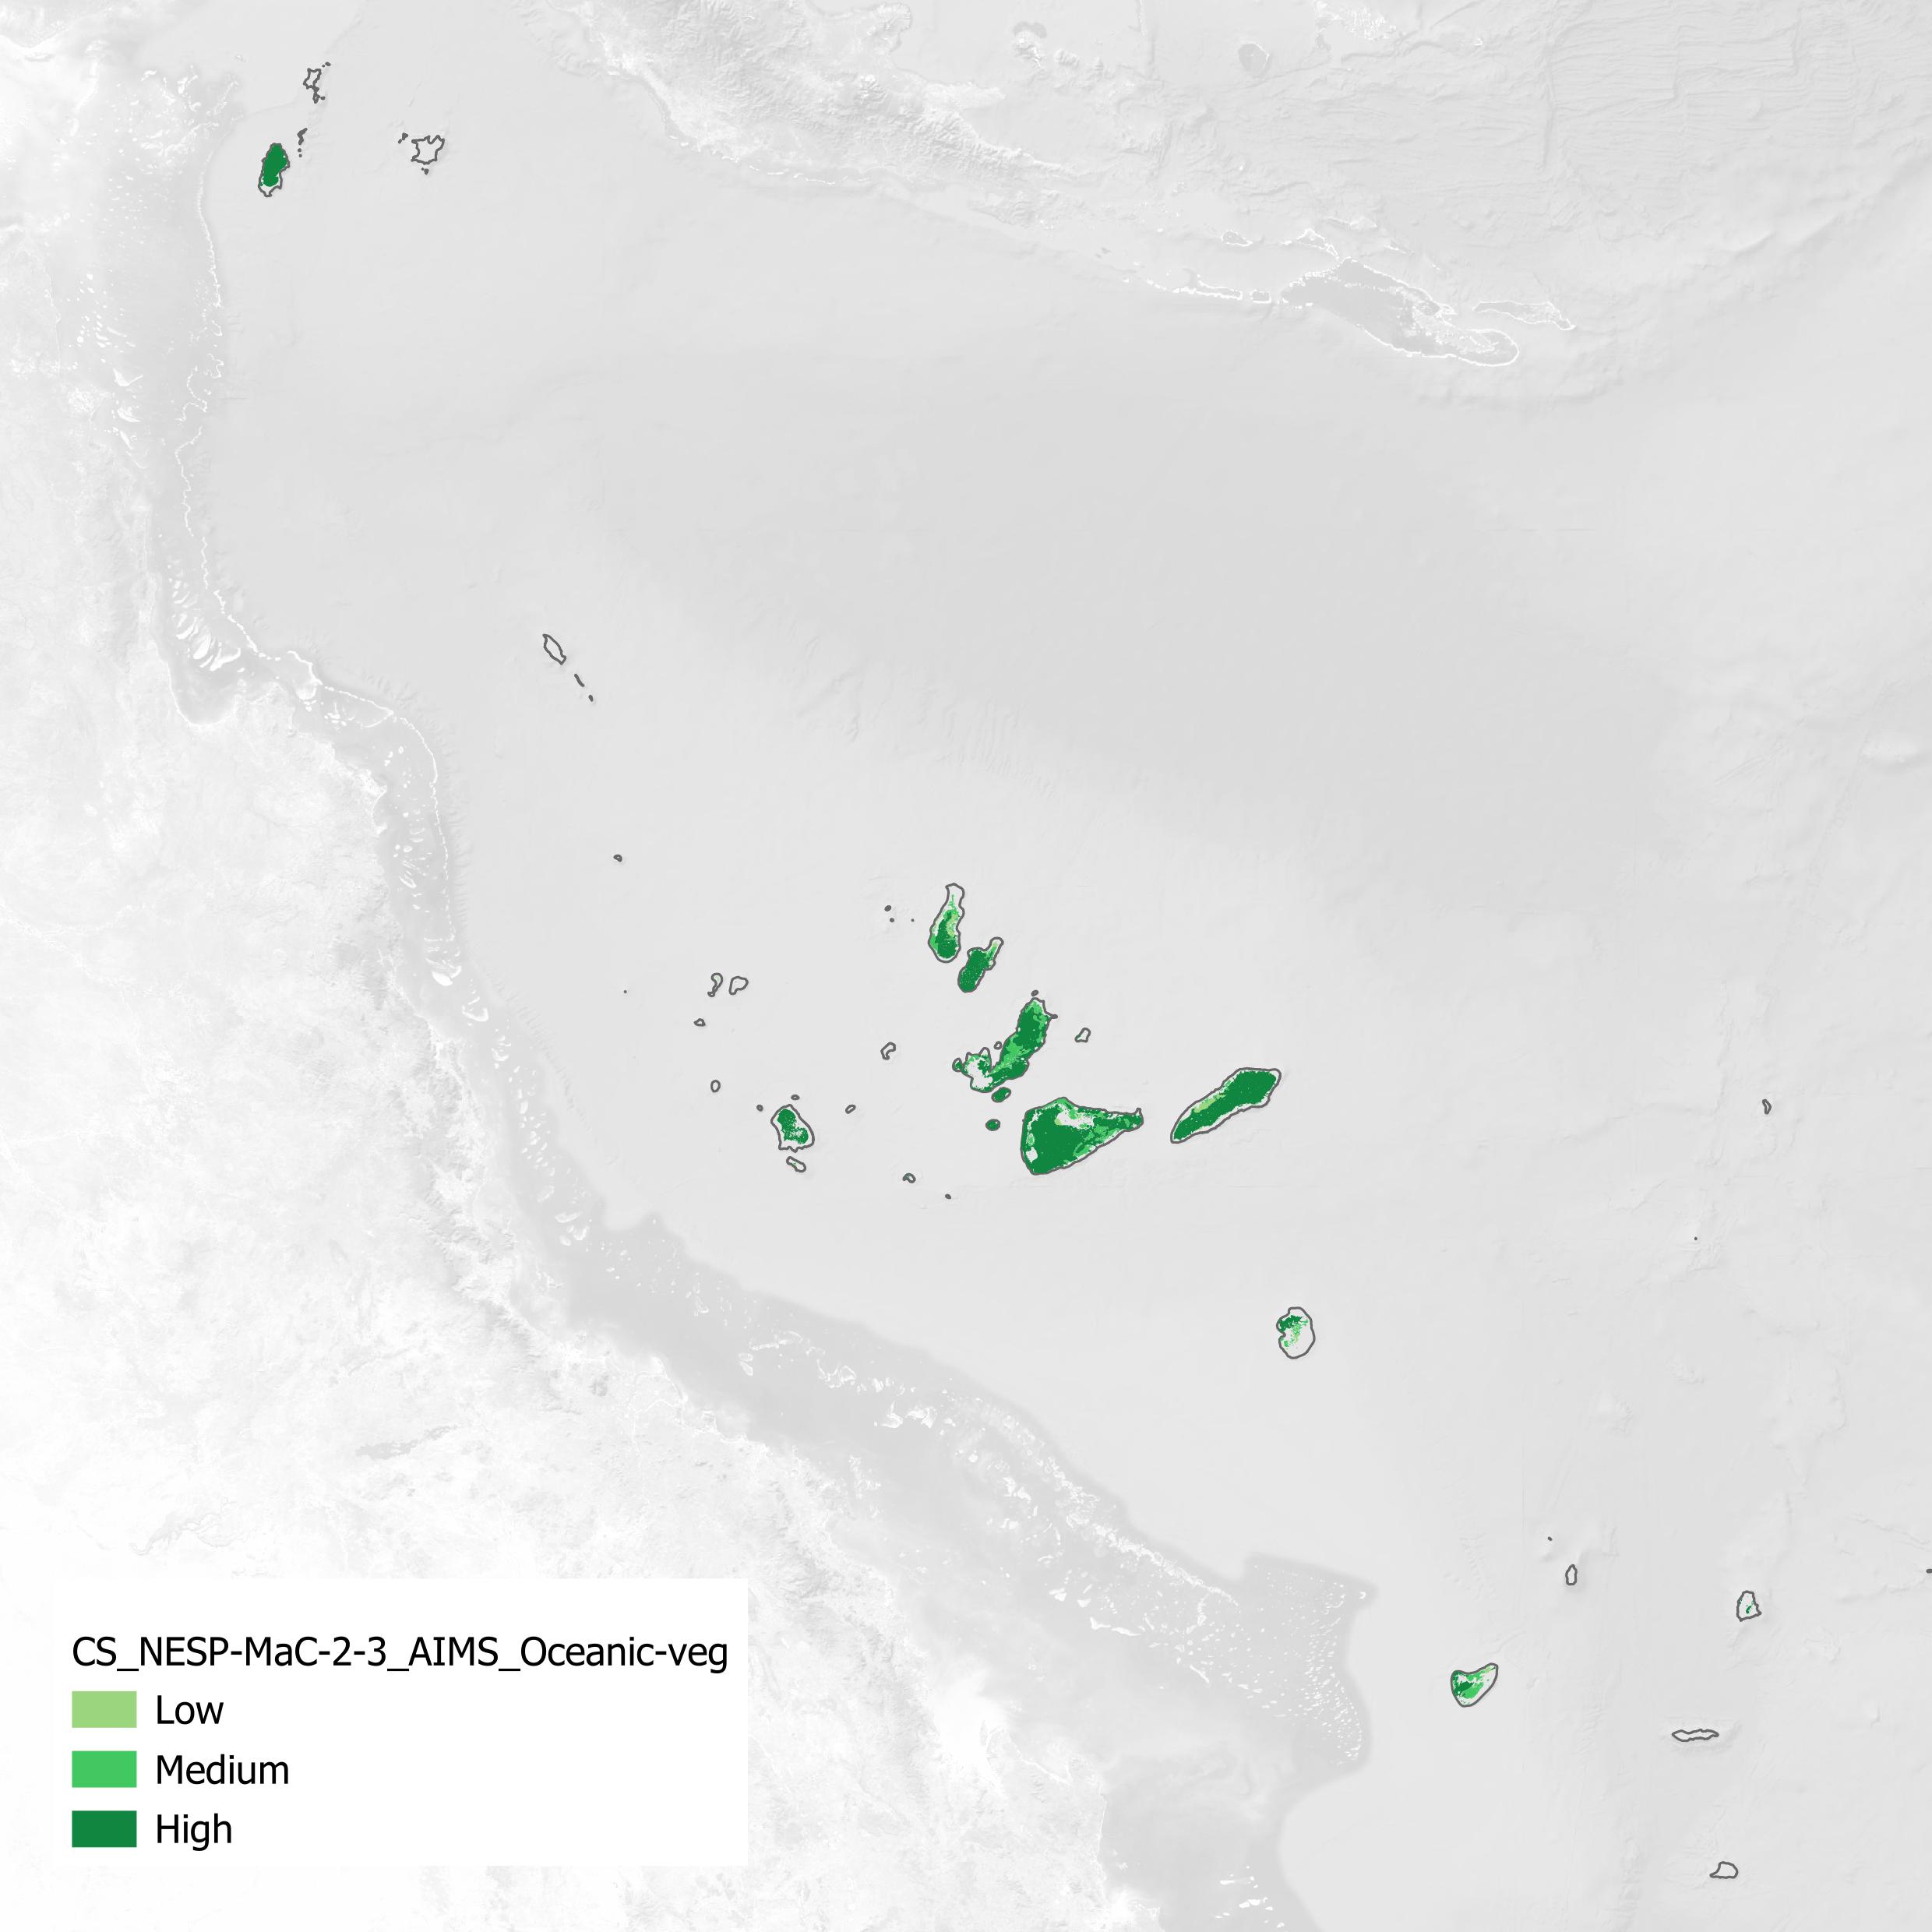
Coral Sea Oceanic Vegetation (NESP MaC 2.3, AIMS)
This dataset is a vector shapefile mapping the deep vegetation on the bottom of the coral atoll lagoons in the Coral Sea within the Australian EEZ. This mapped vegetation predominantly corresponds to erect macroalgae, erect calcifying algae and filamentous algae, with an average algae benthic cover of approximately 30 - 40%. Marine vegetation on shallow reef areas were excluded due to the difficulty in distinguishing algae from coral. This dataset instead focuses on the vegetation growing on the soft sediments between the reefs in the lagoons.
This dataset was mapped from contrast enhanced Sentinel 2 composite imagery (Lawrey and Hammerton, 2022, https://doi.org/10.26274/NH77-ZW79). Most of the mapped atoll lagoon areas were 45 - 70 m deep. Mapping at such depths from satellite imagery is difficult and ambiguous due to there only being a single colour band (Blue B2) that provides useful information about the benthic features at this depth. Additionally satellite sensor noise, cloud artefacts, water clarity changes, uncorrected sun glint, and detector brightness shifts all make it difficult to distinguish between high and low benthic cover at depth. To compensate for some of these anomalies the benthic mapping was digitised manually using visual cues. The most important element was to identify locations where there were clear transitions between sandy areas (with a high benthic reflectance) and vegetation areas (with a low reflectance). These contrast transitions can then act as a local reference for the image contrast between light and dark substrates. These transitions were often clearest around the many patch reefs in the lagoons which have a clear grazing halo of bare sand around their perimeter. These are often then further surrounded by an intensely dark halo, presumably from a high cover of algae. These concentric rings of light and dark substrate provided local references for the image brightness of low and high benthic cover. These cues also indicated where the hard coral substrate were. These were cut out from this dataset.
Validation:
Since this dataset was mapped manually from noisy and ambiguous imagery it was important to establish the validity of the visual mapping approach.
The manual visual mapping was based on the assumption that the higher the benthic cover of algae, the lower the benthic reflectance. The mapped vegetation therefore corresponded to locations where the benthic reflectance is low, noting that we exclude coral reef hard substrate.
To verify if we could reliably map low benthic reflectance areas we first mapped North Flinders and Holmes reefs using visual techniques, then compared this with a direct estimate of benthic reflectance determined by combining the satellite imagery with high resolution bathymetry (Lawrey, 2024, https://doi.org/10.26274/s2a8-nw72). This estimate of the benthic reflectance adjusted the satellite image to the brightness and contrast levels expected for the known depths. This showed there was very strong alignment between the manual visual mapping and low benthic reflectance. The main deviations were with the fine details around reefs, and in some parts where the water clarity made it difficult to determine if the area was vegetation, deep, or water with high CDOM.
Unfortunately, the high resolution bathymetry needed for the benthic reflectance estimation was not available for the rest of the Coral Sea and so it was mapped from just the manual visual mapping from the satellite imagery (Lawrey and Hammerton, 2022, https://doi.org/10.26274/NH77-ZW79) based on lessons learnt from North Flinders and Holmes reefs.
The final mapped areas in Holmes, Tregrosse and Lihou Reefs were validated against a drop camera survey conducted by JCU in 2022 (yet to be published). From this 219 survey locations overlapped the atoll lagoons. Preliminary analysis indicating that areas mapped in this dataset as having high benthic vegetation typically have 15 - 70% (average 42%) algal benthic cover, typically as a mix of erect macroalgae, erect calcareous algae and filamentous algae. Lagoonal areas that were mapped as sand (i.e. areas outside the mapped vegetation, but not on a reef) typically have a much lower algal benthic cover of 0 - 22% with an average of 4%. These areas were also typically turf algae.
Method:
To allow the deep benthic features to be seen the blue channel of the image composites was greatly contrast enhanced to show the very faint differences in brightness due to changes in the benthos. The amount of contrast enhancement, and thus the maximum depth that could be analysed was limited by the visual anomalies in the imagery and the magnified variations in brightness across the images due to the following:
- Remnant patches from masked clouds.
- Remnant patches from cloud shadows that were not fully masked.
- Sentinel 2 MSI detector brightness offsets.
- Uncorrected tonal change across the full Sentinel swath (western side is brighter than the eastern side).
- Coloured Dissolved Organic Matter in the water increases the light attenuation, making areas darker than they would appear in clear water. This tends to occur in areas with low water flushing.
- Sensor noise in the imagery.
- Remnant sun glint correction due to surface waves.
At depth (below ~40 m), only sandy areas are visible as they reflect enough light to be visible above the surrounding visual noise. These sandy areas create a negative space around reefs and patches of dark vegetation, making their shapes visible. Most areas of the coral atoll lagoons are gently sloping meaning that sudden changes in visual brightness are likely due to changes in benthic reflectance, rather than changes in depth. We use this fact to find the visual edge of regions of low benthic reflectance (vegetation).
The benthic cover (vegetation, coral or sand) was determined by manual inspection of the contrast enhanced imagery, looking for the following visual cues:
- Grazing halos around patch reefs: a pale ring corresponding to bare sand surrounding a textured dark, rounded feature (patch reef). The grazing halo is typically at a similar depth to the surrounding area. This was verified by analysing bathymetry transects across patch reefs in North Flinders reef. The grazing halo therefore serves as a local brightness reference for a high benthic reflectance substrate. Often the grazing halo is surrounded by a dark halo of extra dense vegetation. This dark ring provides a brightness reference for high density vegetation. These brightness thresholds are then used to assess the density of the more distance areas around the reef. If the area is close in darkness to the dark ring around the reef then it is considered high density vegetation. If it is closer to the grazing halo bare sand then it is considered to be free of vegetation.
- Reefs without grazing halos: In some cases the patch reefs do not have a pale grazing halo around them. In these cases we identify the reef by its pale circular shape, combined with evidence that it is a tall structure, by checking if it is visible in the green channel (B3), indicating that it reaches within 30 m of the surface or the available bathymetry indicates the vertical nature of the reef. These patch reefs also typically have a dark halo around them, often darker than the surrounding flat lagoonal areas. These dark rings are used as an indication of the brightness level corresponding to high density vegetation.
- Low relief flat reefs: In the western side of the Tregrosse reefs platform there are quite a few dark round features that according to the bathymetry have only a limited relief of less than 8 m. These often have a small grazing halo around their border. It is unclear what the exact nature is of these reefs are, however we assume they are reefal in nature and so we exclude them from the vegetation mapping.
- On the atoll plains, particularly on the western side of Tregrosse Reefs platform there are large patches of dark substrate that have clearly blank sandy patches, unrelated to the presence of reefs. In these cases the pale patches are assumed to be bare sand and serve as a high benthic reflectance guide.
Limitations:
This dataset was mapped at a scale of 1:400k, with our goal being to limit the maximum boundary error to 400 m. Where the imagery was clear the mapped boundary accuracy is likely to be significantly better than this threshold. The spacing of the digitised polygon vertices was adjusted to reflect the level of uncertainty in the boundary. Where visibility was good the digitisation spacing was 100 - 200 m. In high uncertainty areas the digitised distance was increased to 500 - 1000 m. The likely boundary error is approximately equal to the vertex spacing.
Many of the large areas of vegetation were littered with hundreds of small patches of lower or no vegetation. These areas were cut out as holes in the digitisation where the holes were a feature larger than 200 - 300 m in size.
The vegetation areas were categorised into three levels of vegetation density (Low, Medium and High) based on how dark the substrate appeared, relative to the nearby reference indicators (dark halos around reefs, and clear patches of bare sand). In practice the accuracy of this categorisation is probably quite low, as areas where only cut into these different categories at a large scale.
It was very difficult to determine the extent of the vegetation in the lagoon of Ashmore Reef. The lagoon appears to have a low flushing rate and a high amount of CDOM accumulates in the lagoon, reducing the visibility to the point were most of the benthos of most of the lagoon is not visible. To help map this reef the full series of Sentinel 2 images was carefully reviewed for tonal differences that indicate the areas of sand and vegetation. Only 20% of the boundary of the vegetation could be accurately determined, the rest of the mapped boundary is speculative.
Data dictionary:
- Density: Estimated density of the benthic cover in three categories, Low, Medium and High. Sandy areas, or areas with very low cover were not digitised. Comparing this data to preliminary drop camera results indicates that Low and Medium correspond to an average of 30% benthic cover and High an average of 40% cover.
- EdgeAcc_m: (Integer) Approximate accuracy of the feature boundary. Note that in this edition of the dataset only very few polygons were individually tagged with accuracy values. The spacing of the polygon vertices is a better local scale measure of the edge accuracy.
- EdgeSrc (Edge Image Sources): (String, 255 characters) The source of the imagery used to digitise the feature or refine its boundary.
- Type: Type of the feature. In this dataset all features were 'Algae'.
- TypeConf: This is the confidence that the features mapped correspond to the type specified. Care was taken to exclude reefs substrate in the mapped areas, however due to the relative coarse scale of the dataset, some sandy areas and reef areas would be included in some of the polygons.
- Area_km2: Area of the polygons in square kilometres.
- NvclEco: Natural Values Common Language Ecosystem classification for this feature type. All features are 'Oceanic vegetated sediments'.
- NvclEcoComp: Natural Values Common Language Ecosystem Complex classification. All features are 'Ocean coral reefs
eAtlas Processing:
No modifications were made to the data as part of publication.
Location of the data:
This dataset is filed in the eAtlas enduring data repository at: data\custodian\2022-2024-NESP-MaC-2\2.3_Improved-Aus-Marine-Park-knowledge\CS_NESP-MaC-2-3_AIMS_Oceanic-veg
Simple
Identification info
- Date (Creation)
- 2024-03-18
- Citation identifier
- Digital Object Identifier/https://doi.org/10.26274/709g-aq12
Principal investigator
Lawrey, Eric, DrAustralian Institute of Marine Science
- Purpose
- This dataset was developed for inclusion into the Natural Values Ecosystem national habitat map used by Parks Australia.
- Credit
- The data collections described in this record are funded by the Australian Government Department of Climate Change, Energy, the Environment and Water (DCCEEW) through the NESP Marine and Coastal Hub. In addition to NESP (DCCEEW) funding, this project is matched by an equivalent amount of in-kind support and co-investment from project partners and collaborators.
- Status
- Completed
Point of contact
Lawrey, Eric, DrAustralian Institute of Marine Science
- Spatial representation type
- Vector
- Topic category
-
- Biota
Extent
Extent

Temporal extent
- Time period
- 2016-06-08 2021-09-15
- Maintenance and update frequency
- As needed
- Keywords (Theme)
-
- marine
- Keywords (Place)
-
- Coral Sea
- theme.sciencekeywords-8.1_.rdf
-
- BENTHIC HABITAT
Resource constraints
- Linkage
-
https://i.creativecommons.org/l/by/4.0/88x31.png
License Graphic
- Title
- Creative Commons Attribution 4.0 International License
- Alternate title
- CC-BY
- Edition
- 4.0
- Website
-
http://creativecommons.org/licenses/by/4.0/
License Text
- Other constraints
- Cite as: Lawrey, E. (2024). Coral Sea Oceanic Vegetation (NESP MaC 2.3, AIMS) [Data set]. eAtlas. https://doi.org/10.26274/709g-aq12
- Language
- English
- Character encoding
- UTF8
Distribution Information
Distributor
Publisher
eAtlas Data ManagerAustralian Institute of Marine Science (AIMS)
- OnLine resource
-
Download data
Shapefile (1MB)
- OnLine resource
-
Code repository
GIS files and Python scripts for downloading source data
- OnLine resource
-
Input data
Lawrey, E., & Hammerton, M. (2022). Coral Sea features satellite imagery and raw depth contours (Sentinel 2 and Landsat 8) 2015 – 2021 (AIMS) [Data set]. eAtlas.
- OnLine resource
-
Input data
Lawrey, E. (2024). Estimating benthic reflectance of deep coral atoll lagoons from satellite imagery and bathymetry - Analysis code and case studies (NESP MaC 2.3, AIMS) [Data set]. eAtlas.
- OnLine resource
-
Input data
Lawrey, E., Hammerton, M. (2024). Marine satellite imagery test collections (AIMS) [Data set]. eAtlas.
- OnLine resource
- nesp-mac-2:CS_NESP-MaC-2-3_AIMS_Oceanic-veg
- OnLine resource
- Interactive map of this dataset
Resource lineage
- Hierarchy level
- Dataset
Reference System Information
- Reference system identifier
- WGS 1984
Metadata constraints
- Linkage
-
https://i.creativecommons.org/l/by/4.0/88x31.png
License Graphic
- Title
- Creative Commons Attribution 4.0 International License
- Alternate title
- CC-BY
- Edition
- 4.0
- Website
-
http://creativecommons.org/licenses/by/4.0/
License Text
Metadata
- Metadata identifier
- urn:uuid/9b26bf43-3368-41a5-922e-0bf94529d0d2
- Language
- English
- Character encoding
- anyValidURI
Point of contact
eAtlas Data ManagerAustralian Institute of Marine Science (AIMS)
- Parent metadata
Type of resource
- Resource scope
- Dataset
- Metadata linkage
- https://eatlas.org.au/data/uuid/9b26bf43-3368-41a5-922e-0bf94529d0d2
- Date info (Revision)
- 2024-03-19T13:20:15
- Date info (Creation)
- 2024-03-14T05:28:21
Metadata standard
- Title
- ISO 19115-3.2018
Overviews


Spatial extent

Provided by