
Environmental research, maps and data for tropical Australia
Recent articles
-
Published on26 May 2022
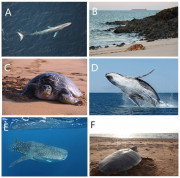 We used data from satellite telemetry tags attached to six species of threatened and migratory marine megafauna across three taxonomic groups (marine turtles, whales and sharks) off the coast of north-western Australia to map their areas of use. We then compiled spatial data from a range of threats and overlayed species and threat maps to assess the level of exposure of the species to threats. In doing so we can identify areas where there is high exposure of species to threats, where risk assessments can be best directed with resulting management actions if needed in order to protect these species.
 -
Published on26 May 2022
 We use genetics to estimate how far and wide oyster larvae can disperse to assist in setting biologically relevant spatial boundaries and harvest limits for oysters.
 -
Published on26 May 2022
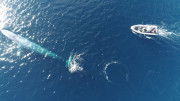 To assist in recovery of the population, spatial areas of importance to pygmy blue whales, known as Biologically Important Areas (BIA), have been identified by the Australian Government. The AIMS team and collaborators Centre for Whale Research and Curtin University set out to reduce uncertainty in identifying where important foraging areas for this species and their migration pathways and distribution exist, and the extent to which they overlap with anthropogenic activities by deploying satellite tags.
 -
Published on26 May 2022
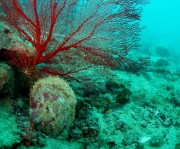
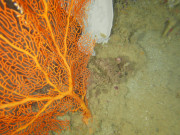 Key Ecological Features (KEFs) are parts of the marine ecosystem considered to be of particular importance for either a region's biodiversity or its ecosystem function and integrity. 13 KEFs have been defined for Australia’s North-west Marine Region, including the ‘Ancient Coastline at 125m depth contour’ (AC125). The AC125 is thought to “provide areas of hard substrate and therefore may provide sites for higher diversity and enhanced species richness relative to surrounding areas of predominantly soft sediment.” Little is known about what habitats exist on the sea floor in the AC125. Part of the reason is that the AC125 is very deep, and thus difficult to observe. The North West Shoals to Shore Research Program took underwater photographs and video of the seafloor to better understand each AC125 Area within its local context.
 -
Published on23 April 2021
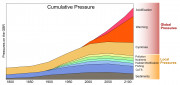 This site provides an introduction to cumulative impacts on coral reefs and outlines some of the latest research into understanding the interactive effects of these impacts and which affect different coral types the most.
Recent datasets

The study focused on the impacts of catchment development on estuaries. Our previous NESP NAER study showed that for three rivers in the Gulf, nutrient addition to intertidal mudflat cores stimulated production and by inference, a reduction in nutrients,e.g. increased extraction of water, would negatively impact primary production. The current study expanded this further to examine additional estuaries in northern Australia, i.e.

This dataset is a set of raster tidal statistics for the Australian region at a 1/32 degree resolution derived from the EOT20 global tidal model. This dataset provides rasters for Lowest Predicted Tide (LPT), Highest Predicted Tide (HPT), Mean Low Spring Water (MLSW), Mean High Spring Water (MHSW), tidal range (HPT-LPT), tidal percentiles (1, 2, 5, 10, 20, 50, 80, 90, 95, 98, 99) and monthly climatologies (median over all simulated years for a given month) of LPT, Mean, and HPT.

This dataset summarises benthic habitat and fish surveys in West Cape York, including the West Cape York Marine Park (Commonwealth), southern Dugong Sanctuary, Angkamuthi and Kaurareg Sea Country into 2 GIS shapefiles.
(1) A point (site) shapefile showing point location of 407 habitat survey sites.
(2) A point (site) shapefile showing point location of BRUV (baited remote underwater video) deployments to survey fish at 42 sites.

This dataset summarises subtidal benthic surveys in Yanyuwa Sea Country into 3 GIS shapefiles.
(1) A point (site) shapefile describes seagrass presence/absence at 849 subtidal sites surveyed by vessel.
(2) The meadow shapefile describes attributes of 46 subtidal seagrass meadows.
(3) The interpolation shapefile describes variation in subtidal seagrass biomass across the seagrass meadows.

This dataset contains the spatial analysis workflow, data derived from the spatial analysis, and R code to identify the blue carbon restoration opportunity in three case study regions in Australia:
1) Fitzroy Basin, QLD;
2) Peel-Harvey and northern part of South West Catchments, WA; and
3) Ord River, WA.