eAtlas Data Catalogue
Spatial scenarios of future land use to 2035 for the GBR coastal zone (NERP TE 9.4, JCU)
This dataset consists of different possible land use configurations along the Great Barrier Reef coastal zone for the future (year 2035) under eight different scenarios (plausible futures). Scenarios are not predictions and do not intend to show what the coastal zone will look like (this is impossible as the future of coastal development I highly uncertain, even on a short term basis, let alone 25 years). Instead, scenarios are used to depict some plausible futures under certain circumstances so that managers can understand the system better and the various ways the future might unfold. Scenarios are built to broaden the extremities of possibilities in order to assert the main differences. The scenarios are then used to conduct impact assessments and this helps managers better understand the connections between land spatial planning and the effects on the values of the GBR World Heritage Area. The results can also be incorporated in the process for spatial planning of coastal development.
These scenarios were built using workshops and literature reviews and are based on different combinations of socio-economic factors driving the amount of change of the different land uses and of strength of governance systems (strong or weak). Figure 1 contains summaries of the storylines of the scenarios. These were translated in quantitative and spatial rules of change for land uses (transition matrix of land use change were created for each scenario and GIS layers were created for each spatial rule later combined to fit each scenario). The land use change modelling took several steps, all conducting the IDRISI Land Use Change Modeler. The first stage was to establish the best bio-physical predictors of change in land use. This was done using [see Bio-physical predictors of coastal Land use change between 1999 and 2009]. The outputs were transition probability maps for each change between one land use to another. The second stage was to use these transition probability maps, the quantitative matrices of change and the spatial rule layers to assign change and produce land use change configurations (the scenarios) to 2035.
The modelling of the land use change was done at a 50m pixel scale. This was however aggregated to a resolution of 500m as presented here to ensure that the dataset is not seen as an accurate set of maps. The “predictive” power of change of the system is not expected to be accurate at the scale of 50m as the land use changes are applied in a probabilistic manner. As a result new allocated land may follow random pattern at the small scale and so the shape of the new areas do not necessarily have a structure that is natural for each land use type. An example of this is that in reality new residential developments tend to be rectangular in shape. However transitions to residential areas in the model tend to be scattered. To get around the excessive precision of the model this final dataset is aggregated to a resolution of 500m, where each pixel corresponds to the majority land use for that area.
Format:
The following rasters (GRID format) constitute the dataset of the spatially-explicit scenarios. They each represent land use maps for the terrestrial part of the Great Barrier Reef coastal zone in the past in 1999 (QLUMP data) and in 2009 (QLUMP data) and in the 8 scenarios produced as part of the NERP 9.4 project. See Figure 1 for detail of scenarios.
1999 : QLUMP 1999 data
2009 : QLUMP 2009 data
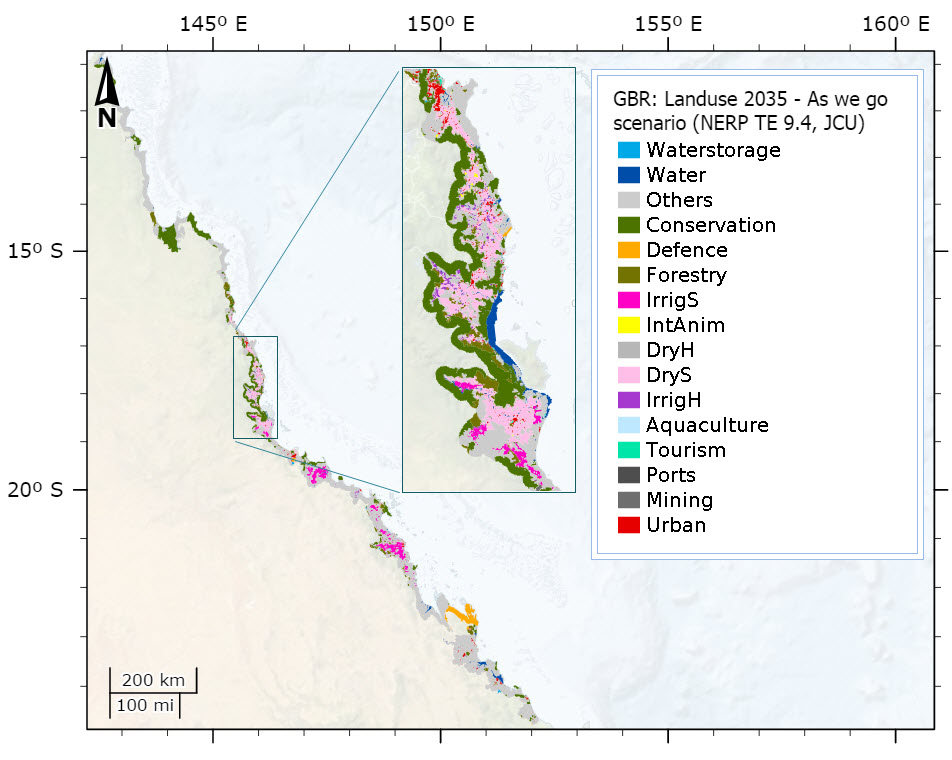
AWG : Scenario As We Go (Business as usual in weak governance)
EM : Scenario Export Management (Food and Minerals in strong governance)
ER : Scenario Eco-Revolution (Green in strong governance)
GW : Green Washing (Green in weak governance)
RTC : Red Tape Cutting (Food and Minerals in weak governance)
TH : Tourism Heaven (Tourism in strong governance)
TOT : Twist on Trend (Business as Usual in strong governance)
WFR : Way For Resorts (Tourism in weak governance)
The classification of all rasters is as follow:
PIXEL VALUE | PIXEL CLASS | NOTES
1 | Ocean | Not coastal zone
2 | Land | Not coastal zone
3 | Waterstorage | Human-made water storage (lakes/reservoirs)
4 | Water | Rivers, lakes estuaries etc
5 | Others | Mainly natural vegetation with grazing
6 | Conservation | Areas protected under IUCM status up to level IV
7 | Defence | Land with no entry permitted held by the Armies
8 | Forestry | Commercial plantations for timber
9 | IrrigS | Sugar cane fields requiring irrigation
10 | IntAnim | Indoor or improved pastures for high-density animal farms
11 | DryH | Crops, orchards, nut plantations, cotton with no irrigation
12 | DryS | Sugar cane fields with no irrigation
13 | IrrigH | Crops, orchards, nut plantations, cotton requiring irrigation
14 | Aquaculture | Land-based only
15 | Tourism | Areas built-up or used for tourism purposes
16 | Ports | Areas of commercial port infrastructure
17 | Mining | Areas under mining and related infrastructures
18 | Urban | Residential, retail and industrial areas (cities, towns)
Part of the dataset includes a symbology layer filer that will automatically format the display in the best format for visualisation.
classificationfromidrisi.lyr:
This file contains the symbology (colour scheme for land use classes) to display the land maps and scenarios of the GBR coastal zone.
Simple
Identification info
- Date (Publication)
- 2015-01-20
Principal investigator
Augé, Amélie, DrAustralian Research Council Centre of Excellence for Coral Reef Studies (JCU)
Collaborator
Pressey, Bob, Prof.Australian Research Council Centre of Excellence for Coral Reef Studies (JCU)
Point of contact
Augé, Amélie, DrAustralian Research Council Centre of Excellence for Coral Reef Studies (JCU)
- Spatial representation type
- Grid
- Topic category
-
- Planning cadastre
Extent
Extent
- Description
- Great Barrier Reef, Australia

Temporal extent
- Time position
- 1999-01-01T00:00:00
- Time position
- 2035-12-31T00:00:00
Resource constraints
- Linkage
-
http://i.creativecommons.org/l/by/3.0/au/88x31.png
License Graphic
- Title
- Creative Commons Attribution 3.0 Australia License
- Website
-
http://creativecommons.org/licenses/by/3.0/au/
License Text
- Language
- English
- Character encoding
- UTF8
Distribution Information
- OnLine resource
- Project web site
- OnLine resource
- eAtlas Web Mapping Service (WMS) (AIMS)
- OnLine resource
- Landsuse Scenarios (1999, 2009, 8 future scenarios) Geotiff format (converted from GRID format). [Zip 683 kB]
- OnLine resource
- Landsuse Scenarios (1999, 2009, 8 future scenarios) Shapefile format (converted from GeoTiffs). [Zip 3.6 MB]
- OnLine resource
- Interactive map of the 10 layers associated with this dataset.
- OnLine resource
- nerp:GBR_NERP-TE-9-4_JCU_Scenarios_AWG
Metadata constraints
- Linkage
-
http://i.creativecommons.org/l/by/3.0/au/88x31.png
License Graphic
- Title
- Creative Commons Attribution 3.0 Australia License
- Website
-
http://creativecommons.org/licenses/by/3.0/au/
License Text
Metadata
- Metadata identifier
- urn:uuid/9da930aa-1b72-45a6-9bff-03f57b028370
- Language
- English
- Character encoding
- UTF8
Point of contact
eAtlas Data ManagerAustralian Institute of Marine Science (AIMS)
Type of resource
- Resource scope
- Dataset
- Metadata linkage
-
https://eatlas.org.au/data/uuid/9da930aa-1b72-45a6-9bff-03f57b028370
Point of truth URL of this metadata record
- Date info (Creation)
- 2015-11-26T16:40:17
- Date info (Revision)
- 2023-09-18T08:59:03
Metadata standard
- Title
- ISO 19115-3:2018
Overviews
Spatial extent

Provided by