This site provides an introduction to cumulative impacts on coral reefs and outlines some of the latest research into understanding the interactive effects of these impacts and which affect different coral types the most.
Dynamic reefs
Hard corals are the dominant feature of coral reefs. Their skeletons bind together, with help from other calcifying organisms and algae, to build the foundation of reefs themselves. The live corals provide complex structures that provide homes and protection for most reef inhabitants. Corals are an important group of animals because they create the dominant habitat on coral reefs that support thousands of other fish and invertebrate species.
The amount of live coral cover on a reef, which is measured as the percentage area of the reef that is covered with live coral, is often used as indicator of current reef health as it estimates the beneficial habitat provided by corals. However, coral cover is rarely static as reefs are dynamic environments, cycling through periods of destruction and renewal (See Figure 1). In good years corals grow undisturbed, slowly increasing the coral cover. In bad years, coral populations can be devastated by waves caused from passing cyclones, Crown-of-Thorns Starfish outbreaks eating all the live coral, as well as numerous other smaller disturbances such as disease.

 AIMS Reef Monitoring
Figure 1: Photos illustrating the dynamics of reefs over time. Cover on the same transect can be well over 50% in one year, and close to zero in the next.
Increasing pressures
Rising global temperatures due to climate change are serious threat to coral reefs. Higher than average summer temperatures can cause heat stress that leads to coral bleaching and eventually death if the hot conditions persist long enough. Mass bleaching events occurred in 1998, 2002, 2016, 2017 and 2020, with the latter events being more severe and widespread. Marine heatwaves are expected to become more frequent in the future giving coral reefs less time to recover.
In a healthy reef system, coral reefs are resilient and bounce back from disturbances due to influx of new coral recruits from nearby reefs. If, however, the rate of disturbances is too frequent, or the disturbed area is large, reef system resilience is reduced.
Chronic pressures on reefs such as low water quality slow the grow rates of coral reducing the speed at which reefs can recover from acute disturbances. While these pressures don’t result in dramatic loss of coral, they do reduce the growth rate of corals leading to slower recovery time from an acute disturbance.
 Dr Eric Lawrey (eAtlas (Australian Institute of Marine Science)), Australian Institute of Marine Science
Figure 2: This illustrative plot shows the cumulative growing pressures on the GBR. The timing and relative magnitude of these pressures are only rough estimates and primarily provided for illustrative purposes. Many of the local pressures increased with the rapid expansion of the agriculture, fishing, and population growth of Queensland in the 1900's. While climate change is leading to new pressures of warming (causing coral bleaching), and ocean acidification. With good local management in the future we can reduce some of the local pressures partly compensating for increases in the global pressures. Significant global action on climate change is however needed if we are to reduce the significant additional pressures from warming and ocean acidification.
Modified diagram from Duarte (2014) in The Conversation.
Over the past 150 years there has been an increasing number and intensity of pressures on the Great Barrier Reef. These range from land-based pressures such as sedimentation and nutrient input, to global pressures such as climate change and ocean acidification.
A key challenge is understanding the relative strength of the pressures and how they interact. As the climate changes are their ways that we can reduce local pressures to partly compensate for this new added pressure.
Cumulative Impacts Research
This website is an outcome of National Environmental Science Program (NESP) project 1.6, 2.1.6 and 5.2. Full reports are available for both NESP project 1.6 and NESP project 5.2.
The project goal was to "fill important experimental and conceptual gaps in understanding cumulative impacts on coral reef environments". This was achieved through:
- Intensive experimental work focusing on gaps identified in a literature review (link);
- Ecotoxicological modelling and exploration of novel approaches to combine species sensitivity distributions for multiple stressors (link); and
- Collating information on environmental pressures available over the past 20+ years into pressure maps (link) for use in ecosystem modelling to explain changes in state and performance of the most abundant coral populations (tabulate Acropora spp., branching Acropora spp., branching non-Acropora spp., massive). This analysis bring together for the first time data from the Long-term Monitoring Program (LTMP) and Marine Monitoring Program (MMP)(link).
These projects have already resulted in more than 12 scientific publications (link).
This site presents the results of this experimental work and modelling, allowing the reader to explore the inputs and results in more depth.
Experimental work focused on identified knowledge gaps
Figure 3 shows a break down of all the combinations of types of cumulative impacts that can occur. Considering these combinations helps to better understand how to we would expect to see a ecosystem response to each type of cumulative impact. Cumulative impacts can occur from a range of combinations of pressures through time and space. Repeated exposure to a single pressure can accumulate over time if corals don't have time to recover between these events. An example of a single pressure that could accumulate over time would be repeated maintenance dredging in the same area or seasonal runoff repeatedly affecting the same coral reefs. In both these cases the corals need to survive under reduced light conditions and dealing with settling of sedimentation. Pressures over larger spatial scales can occur from multiple simultaneous events, such as dredging in two locations, resulting in a larger spatial impact. Chronic (long-term) exposure to the same pressure, such as water quality issues can result in cumulative impact over time.
In many cases multiple different pressures can affect reefs over time. Reefs might be affected by poor water quality (chronic pressure), a Crown-of-Thorns starfish outbreak in one year, followed by a cyclone damage in a second year. If these events occur more frequently than the reef recovery time, then these pressures accumulate.
Experimental work conducted under this project was guided by the gap analysis conducted in the NESP 1.6 project. In consultation with end-users, the project team focused on climate change and sediment/light or herbicide interactions.
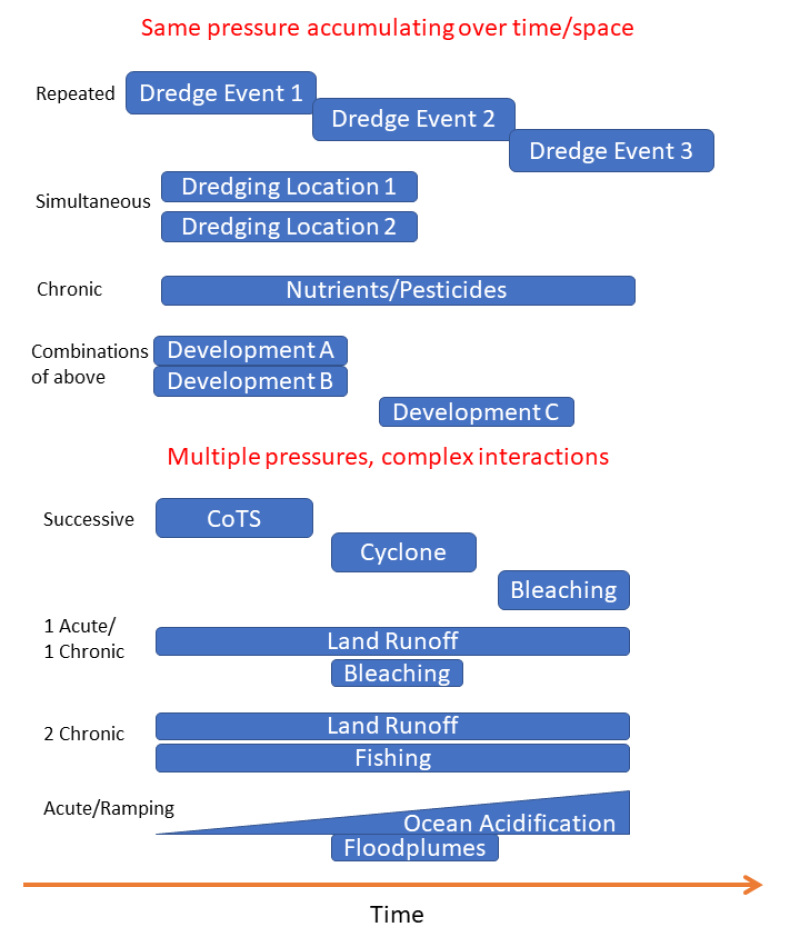
Figure 3: Cumulative effects caused by the same pressure or multiple pressures with complex interactions.
The response and intensity of results depended on the parameters chosen and the organisms studied. Temperature over a certain threshold and climate change scenarios simulating conditions predicted for 2050 or 2100 had negative effects on most responses (e.g. photosynthesis, coral growth) in most organisms. Similarly, increased levels of sediments or herbicides reduced photosynthesis or growth of organisms. In most cases, the combined response to climate change and local stressors was larger than the sum total of individual effects. In other words, increased temperatures - or future predicted climate change - made organisms more vulnerable to the impacts of sediment or herbicides.
Examples of increasing sensitivity of coral reef organisms to herbicides or sediment under the forecast temperature increases of climate change scenarios are shown in the graphs below.
Figure 4a shows the effect of diuron (herbicide) on the photosynthesis of Halophila ovalis seagrass. At high diuron concentrations (> 10 µg / L) the photosynthesis is suppressed by around 90%, which means it will stop growing and potentially die. Each of the different curves show how different temperatures affect the results. On the left side of the graph, when diuron is 0 µg / L, we can see how this seagrass species is affected by just temperature. This shows that the maximum photosynthesis occurs (0% inhibition of photosynthesis) for Halophila ovalis seagrass occurs at 30°C. Its photosystem efficiency drops with higher and lower temperatures resulting in more than 25 % inhibition for temperature < 20°C or above 35-40°C. At a concentration of 2 µg / L diuron starts to have a significant effect on the photosynthesis, resulting in an additive degradation.
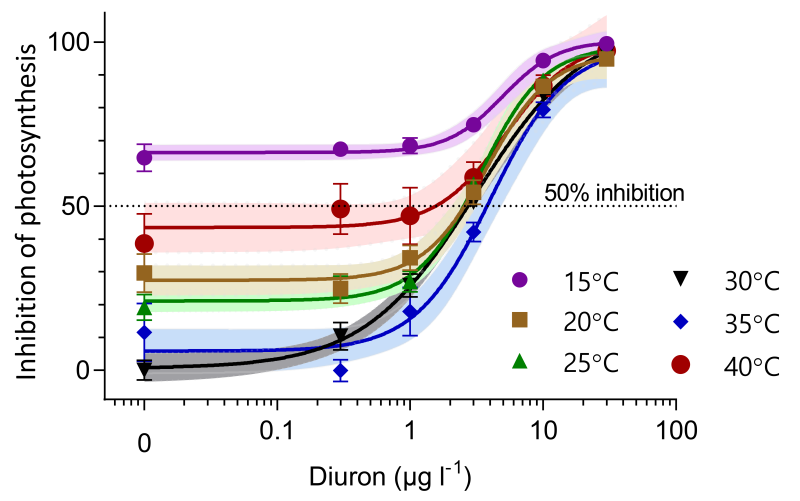
Figure 4a: The effect of the herbicide diuron on the photosynthesis of the seagrass Halophila ovalis was tested under six different temperatures (Wilkinson et al. 2017). The curves illustrate the reduction of photosynthesis caused by the herbicide diuron under different temperature conditions. Above a certain temperature, the seagrass is much more susceptible to the stress induced by diuron.
Figure 4b shows the effect of suspended sediment on the fertilisation success of corals. This shows that high levels of suspended sediment (> 5 mg / L) start to reduce the fertilisation success by approximately 10%. It also shows that temperatures above 27°C further reduce the fertilisation success. To maintain a particular fertilisation success rate, say 50%, the suspended sediments need to be reduced from 30 mg /L to 10 mg / L if the temperature increases from 27°C to 32°C.
This means that for inshore reefs where suspended solids routinely exceed 5 mg / L (see eReefs total suspended solids maps) that significant reductions in suspended solids can partially offset the reduction in fertilisation from rising temperatures.
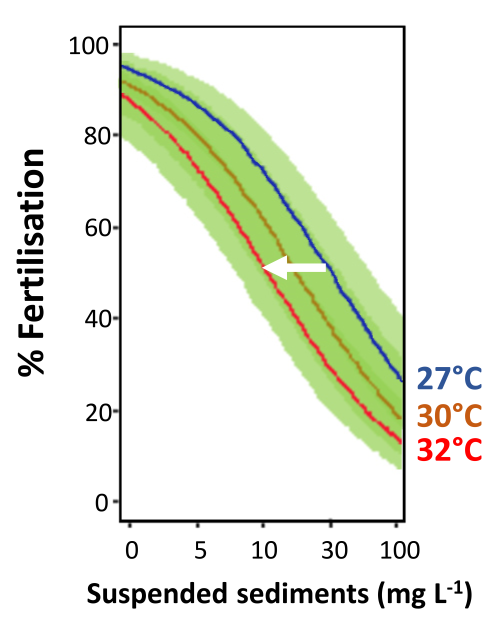
Figure 4b: The effect of sediment load on fertilisation rates of the corals (Humanes et al. 2017) under three different temperatures. For all temperatures, fertilisation rates (hence reproductive output) is reduced when sediment is added, mimicking land runoff or dredging events. 'Above normal' temperatures increase the negative impact of sediment on coral fertilisation. In other words, the susceptibility curves are shifted to the left, as indicated by the arrow.
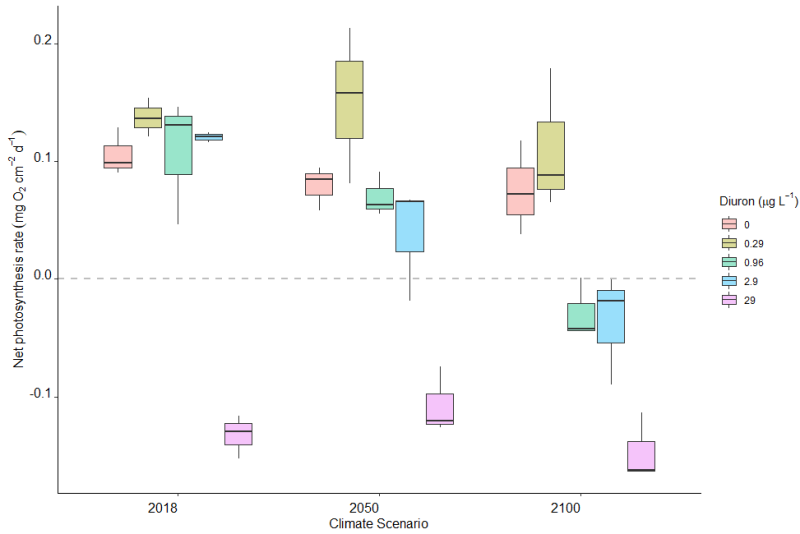
Figure 4c: The effect of the herbicide diuron on the productivity of the coral Acropora millepora, measured as net photosynthetic rate, under three climate scenarios (Flores et al., in prep). At present climate, diuron concentration of ~ 1 µmol has a small effect on coral productivity. The same concentration reduced photosynthesis by 35% and 100% respectively under predicted 2050 and 2100 climate scenarios.
Key lesson: The cumulative impact on coral reefs of climate change and local stressors will be most effectively reduced by both minimising local stressors such as sediment and pesticide run-off, as well as reducing global greenhouse gas emissions.
Ecotoxicological modelling and exploration of novel approaches
Poor water quality along with the increasing frequency of summer heatwaves are two common pressures faced by nearshore coral reefs. Although these pressures often occur at the same time, the potential risks they pose to tropical marine species are generally considered independently. An important management strategy to improve the resilience and recovery of coral reefs is to ensure contaminant concentrations remain below water quality guideline values. However, current guideline values are derived from toxicity experiments performed under optimal conditions and do not account for co-occurring pressures such as heatwave conditions that can affect the toxicity of contaminants.
This project adapted a method usually applied to estimate the total toxicity of multiple contaminants to instead adjust water quality guideline values for contaminants to account for heatwave conditions.
The multi-stressor PAF method was used to mathematically combine the new thermal species sensitivity distributions (Figure 5a) and contaminant species sensitivity distributions (Figure 5b), allowing us to calculate heatwave adjustments for guideline values such as the PC95 (Figure 5c).
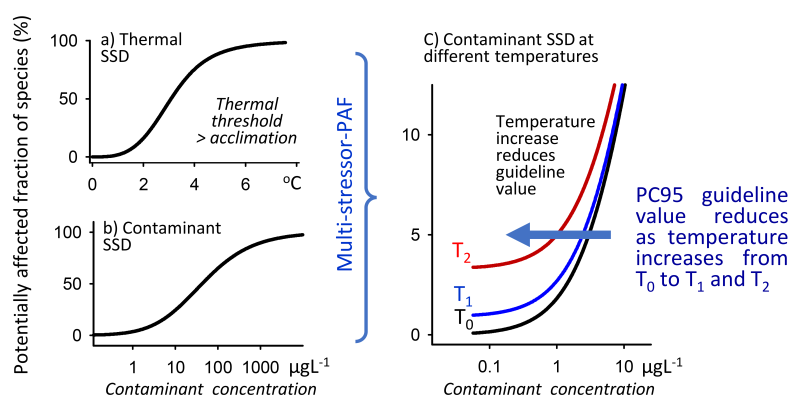
Figure 5: How the effects of contaminants and thermal stress can be combined using multi-stressor PAF (data from Negri et al., 2020). This can be used to adjust water quality guideline values (e.g. PC95) for heatwave conditions. Top left: Species sensitivity distribution showing the percentage of species affected as temperatures increase above normal acclimation. Lower left: Species sensitivity distribution showing the percentage of species affected as contaminant concentration increases. Right:The potentially affected fraction (PAF) of species at three temperatures T0, T1 and T2. Ms-PAF predicts that PC95 decreases slightly as the temperature increases from acclimation (T0 to T1) and by more as the temperature increases again to T2. Negri et al. 2020: https://pubs.acs.org/doi/10.1021/acs.est.9b05961
This method predicts that more species are affected by contaminants as temperatures increase. We examined how the national water quality guideline values for common contaminants such as the herbicide diuron and copper could be adjusted for heatwave conditions (Table 1). For example, the PC95 for diuron would be adjusted from 0.67 µg L-1 to 0.59 µg L-1 if the temperature rose by 1°C above acclimation, while the PC90 of copper would be adjusted from 3.0 to 1.0 at 2°C above acclimation.
The method used in this study can be used to adjust any water quality guideline value for the effects of heatwaves and can also predict how temperature stress thresholds for tropical communities would be reduced in the presence of contaminants. It could be extended to adjust contaminant guideline values to account for other co-stressors relevant to coral reefs (such as sediments, low salinity, anoxia and ocean acidification), offering an additional approach to assess the risks posed by multiple stressors.
Key lesson: Increasing temperatures by 2°C can require contaminant guideline values to be reduced by more than 80%. The scale of adjustment is different for each contaminant.
| Copper | PC99 (µg L-1) | PC95 (µg L-1) | PC90 (µg L-1) | PC80 (µg L-1) | PC50 (µg L-1) |
|---|---|---|---|---|---|
| Diuron | PC99 (µg L-1) | PC95 (µg L-1) | PC90 (µg L-1) | PC80 (µg L-1) | PC50 (µg L-1) |
| Ta | 0.29 | 1.4 | 3.0 | 7.4 | 42 |
| Ta +0.5 °C | 0.25 (14%) | 1.4 (0%) | 3.0 (0%) | 7.4 (0%) | 42 (0%) |
| Ta +1.0 °C | - | 0.90 (36%) | 2.4 (20%) | 6.6 (11%) | 40 (5%) |
| Ta +1.5 °C | - | - | 1.0 (67%) | 4.7 (36%) | 35 (17%) |
| Ta +2.0 °C | - | - | - | 1.3 (82%) | 25 (40%) |
| Ta +2.5 °C | - | - | - | - | 13 (69%) |
| Ta | 0.43 | 0.67 | 0.86 | 1.20 | 2.4 |
| Ta +1.0 °C | - | 0.59 (12%) | 0.80 (7%) | 1.13 (6%) | 2.3 (4%) |
| Ta +1.5 °C | - | - | 0.61 (29%) | 1.0 (17%) | 2.2 (8%) |
| Ta +2.0 °C | - | - | - | 0.66 (45%) | 1.9 (21%) |
| Ta +2.5 °C | - | - | - | - | 1.4 (42%) |
Exposure maps and modelling
In addition to experimental approaches and ecotoxicology work, we used statistical modelling to investigate the effects of multiple pressures on reef communities. We used a combination of environmental variables (exposure maps, which can be explored via the interactive tools below), disturbance variables and coral percent cover data. This dataset is covering a nearly 30-year time series.
Environmental and disturbance variables were composed of data for individual reefs, based on previously published data or an extension of these, and newly extracted data from eReefs. These data can be used as total average over the entire period of summer averages for individual years. This dataset describes the exposure of individual reefs of the Great Barrier Reef to different conditions in water quality (e.g. nutrients, light, salinity, suspended sediments) as well as local disturbances (e.g. crown-of-thorns seastar outbreaks) and global disturbances (e.g. heat stress, cyclones). Coral cover data was collated from the AIMS Long-term Monitoring Program and Marine Monitoring program
These programs collect in situ data on benthic (sea bed) communities on given reefs of the Great Barrier Reef, using similar methodological approaches. The Marine Monitoring Program surveys inshore reefs while the Long-Term Monitoring Program surveys mid-shelf and offshore reefs. Thus, by combining the data from these two programs it is possible to achieve adequate spatial representation of the trajectory of coral communities in the Great Barrier Reef throughout the past 30 years.
Disturbance exposure on reefs of the Great Barrier Reef
Each functional group of corals are affected by pressures in different ways. Massive corals are slow growing, but are more heat tolerant, less vulnerable to wave damage caused by cyclones and not-preferred as food by crown-of-thorns seastars. In comparison branching acropora corals are fast growing, but they are fragile and are favoured as food by crown-of-thorns seastars. Teasing out the relative importance of different pressures for each functional group of corals can be difficult due to the large number of confounding factors, particularly when there are multiple pressures.
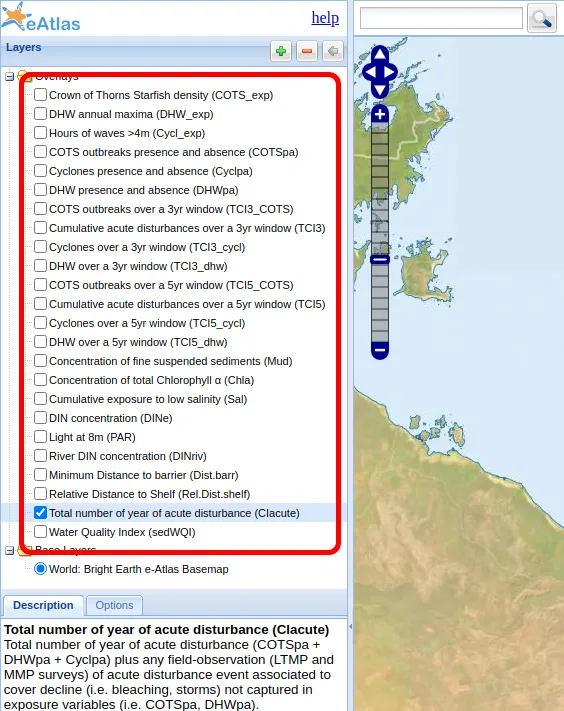
To better understand the relative importance of pressures, and cumulative impacts on each coral functional group a modelling fitting process was used to analyse the relationship between changes in coral cover seen in the AIMS Long Term Monitoring Program (LTMP) and Marine Monitoring Program (MMP) against known disturbances and pressures. Each pressure was converted to an exposure map, indicating when and where these pressures occurred. Cumulative impact factors were also calculated, such as COTS outbreaks over a 5 year period and cyclones over a 5 year period. These can be seen in Figure 6. The coral cover for each of the coral functional groups were calculated from the detailed benthic survey data. This is shown in Figure 7. The coral cover and matching disturbances where then matched up temporally (Figure 8) and used as input data for modelling. The modelling process tried to determine which where the most important factors in predicting the change in coral cover over time.
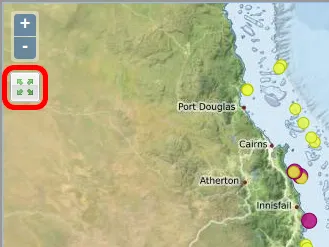
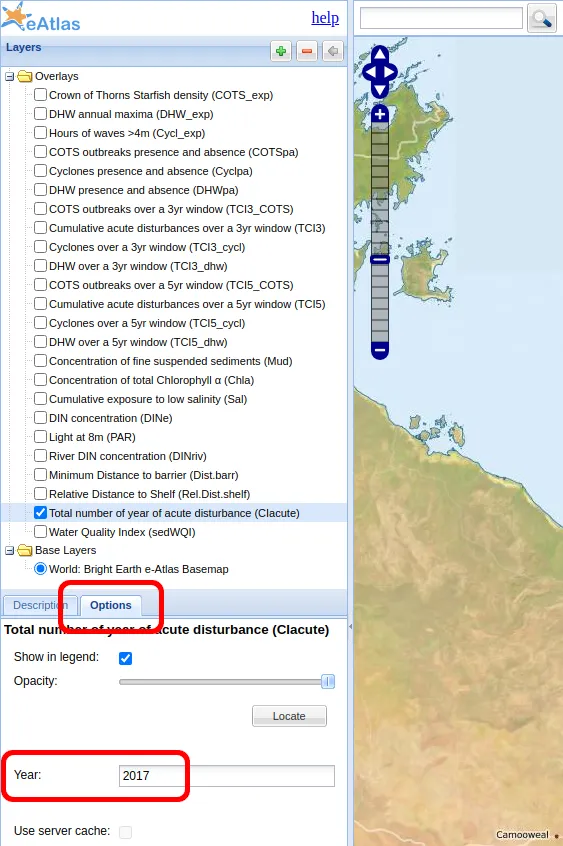
Figure 6: This tool visualises the relative exposure levels due to specific disturbances (bleaching, crown-of-thorns seastar outbreaks and cyclones) for individual reefs that are part of the LTMP/MMP observation datasets. The level of exposure of each disturbance type can be viewed for a specified observation year.
Coral type distribution map
Coral cover and disturbances
Factors that best predict the coral cover change
Statistical modelling can be used to tease out if and how much each of these stressors is affecting the coral community. For the first time, we are not only looking at the total coral cover, but the state and performance (not shown in this tool, please see the NESP TWQ 5.2 project final report) of individual coral growth forms, Acropora tabular, Acropora branching, other branching species, and massive/submassive species.
Our modelling approach allowed us to select the most important predictors of change in state and performance for each region (we analysed the central and southern half of the reef separately) and coral group (see Figure 9). The modelling approach determines which environmental variables and pressures (COTS density, cyclones, degree heating weeks (DHW), etc.) best predict the distribution of the coral cover in space and time. Figure 9 shows the relative importance of these variables.
Although results differ, several general trends were identified.
The best predictors for reef decline were:
- a cumulative index for crown-of-thorns seastar pressure on the reef,
- the frequency and magnitude of cyclones and temperature increases.
Several water quality parameters consistently exhibited high importance scores, but only some made it into the final model selection. This is mainly due to the overwhelming effect of acute pressures caused by crown-of-thorns seastar outbreaks and climate change. We also found insufficient temporal and spatial resolution of water quality parameters prevented assessment of the importance of water quality parameters with high certainty. Filling the latter gap should be considered in future monitoring designs. For example, the most informative parameter (‘River DIN’) is available over the entire time span modelled and had a significant influence on state and performance of several growth forms.
Model limitations
To properly interpret the results of the modelling it is important to consider some of the limitations in the data used to drive the model. This analysis shows the relative importance that each variable has in predicting coral cover based on the available exposure data. The quality of the exposure data (spatially and temporally) influences the strength of this relationship. Some of the exposure variables had a significantly lower data density then the coral data reducing their ability to predict the coral data and thus their relative strength. A second limitation is that the exposure variables for the strongest predictors of coral cover change (COTS, cyclones and bleaching) each had their own limitations that added noise to the analysis. This limited the ability of the model to detect the weaker non-acute relationships. Weak relative importance of variables may be due to an absence of any relationship or a limitation in the quality and scope of the exposure data. A strong relative importance indicates that this variable is important in predicting coral cover.
Key lesson: This modelling approach will help managers to identify the key stressors affecting the state and performance of coral reefs in the central and southern Great Barrier Reef. These results provide information to improve the effectiveness of management decisions to promote coral recovery and conservation in the face of climate change.
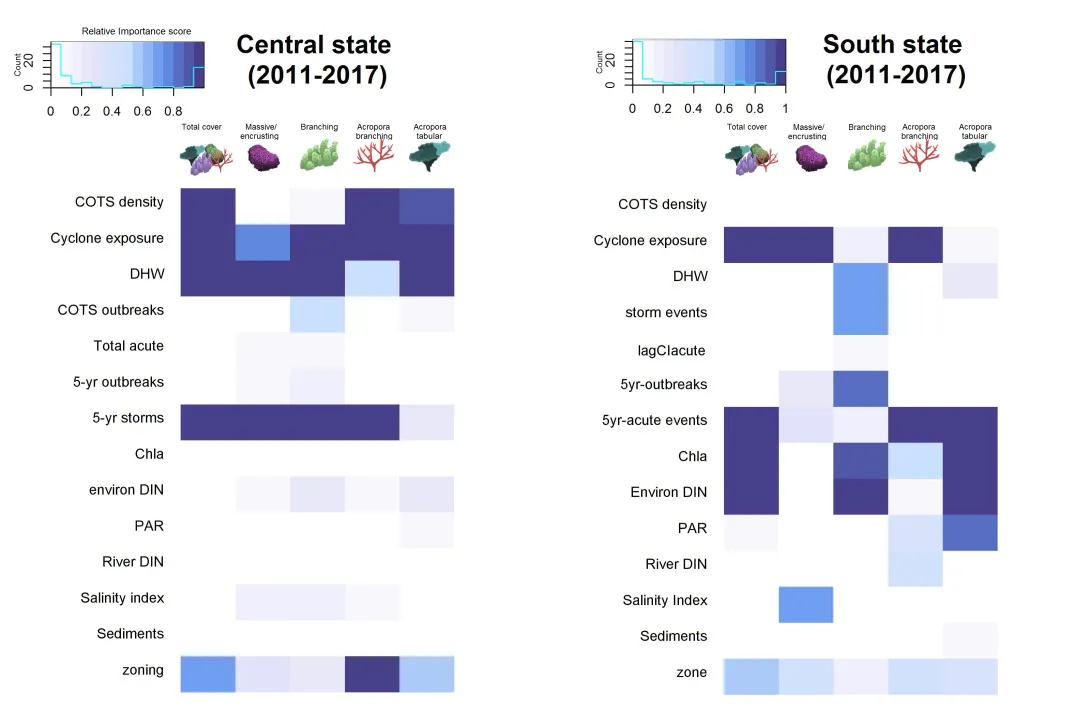
Figure 9: Variable importance to predict the state of total coral cover and that of specific growth forms on central (left) and southern (right) Great Barrier Reef. Exposure to acute disturbances was evaluated using metrics of magnitude and frequency of stressors with lagged effects of one, three, five years. List of variables differ among panels as highly correlated variables were excluded separately from each data set. White boxes indicate the variable was not present in any of the top candidate 'best' models.
A tool illustrating relative importance of multiple disturbances on the state of reefs of the Great Barrier Reef
Modelling outcomes were summarised in a tool that visualises the impacts of individual coral stressors on individual growth forms. This tool (below) is only focused on large, acute disturbances (the ‘three Cs’: crown-of-thorns seastars, cyclones, climate). This does not imply that other chronic disturbances such as water quality (e.g. light, nutrients) are not important. Choose the region and growth form in which you are interested to see which factors provide the largest disturbance.
Summary of findings and recommendations
This project consisted of three major sections:
- hypothesis-driven ecological experiments
- transfer and application of ecotoxicological approaches to climate-related multi-species responses
- development of exposure maps based on extensive compilation of observational and modelled data, in combination with observed and modelled responses of reef community states and performances for the Great Barrier Reef.
The results of these three sections broaden our understanding of the cumulative impacts of climate change and water quality on coral reef ecosystems. An emerging picture is that climate change is the overwhelming driving factor for reef state and reef performance, together with other acute disturbances such of crown-of-thorns seastar outbreaks. Additionally, water quality directly affects specific organisms, especially in areas explicitly exposed to river runoff. Water quality also indirectly affects reef state, e.g. through prolonged exposure to reduced light and increased turbidity, and possibly through contributing to crown-of-thorns seastar outbreaks. A caveat is that relatively few long-term water quality time series and exposure data are available, greatly limiting our capacity to attribute change to water quality factors. The local stress of water quality also interacts with climate change, worsening the outcome for organisms and retarding reef recovery.
Based on our findings we conclude and recommend:
- Local stressors must be taken into consideration when assessing the impact of climate change on coral reef communities.
- Currently unabated climate change and ocean acidification will require the reduction (‘climate adjust’) of thresholds for a variety of contaminants.
- Although the effects of acute stressors (climate, cyclones, crown-of-thorns seastars) overwhelm the influence of water quality parameters in the available pressure layers, modelling studies indicated that the effect of reef state and performance is also influenced by land runoff. Thus, improvement of water quality will assist reef condition.
- Exposure maps and information on the water quality on reefs and locations are limited, and information is often not available over the long temporal scales required to understand their influence on the reef. Better water quality data from within the Great Barrier Reef are necessary to attribute spatial and temporal changes in reef and seagrass communities to episodic and chronic changes in water quality. Improved water quality monitoring and development of new proxies for water quality should both be a priority for future monitoring projects.
- The chronic local stressor of water quality is considered amenable to local management. In contrast, the acute ‘three Cs’ (climate, cyclones, crown-of-thorns seastars) are extremely hard to manage. Of these, only crown-of-thorns seastar outbreaks are (most likely) not a phenomenon requiring global collaborative management effort. Although crown-of-thorns seastars are clearly also not trivial to manage, we argue that increased engagement in understanding and prevention of crown-of-thorns seastar outbreaks is needed in addition to water quality management and global negotiations to reduce or slow climate change.
Scientific publications from this project
- Uthicke, S., Fabricius, K., De’ath, G., Negri, A., Smith, R., Warne, M., Noonan, S., Johansson, C., Gorsuch, H. and Anthony K (2016). Multiple and cumulative impacts on the GBR: assessment of current status and development of improved approaches for management. Final Report Project 1.6. Report to the National Environmental Science Programme. Reef and Rainforest Research Centre Limited, Cairns (144pp.). https://nesptropical.edu.au/wp-content/uploads/2016/08/NESP-TWQ-1.6-FINAL-REPORTA.pdf
- Adams, M., Collier, C., Uthicke, S., Ow, YX., Langlois, L., O’Brien, K (2016). Model fit versus biological relevance: Evaluating photosynthesis-temperature models for three tropical seagrass species. Scientific Reports, 7, 39930, doi:10.1038/srep39930.
- Anthony, KRN (2016). Coral reefs under climate change and ocean acidification - challenges and opportunities for management and policy. Annu. Rev. Environ. Resour., 41, 59–81 (2016). doi:10.1146/annurev-environ-110615-085610
- Humanes, A., Noonan, S., Willis, B., Fabricius, K., Negri, A (2016). Cumulative effects of nutrient enrichment and elevated temperature compromise the early life history stages of the coral Acropora tenuis. PLoS ONE, 11: e0161616. doi:10.1371/journal.pone.0161616
- Humanes, A., Ricardo, G., Willis, B., Fabricius, K., Negri, A. (2017). Cumulative effects of suspended sediments, organic nutrients and temperature stress on early life history stages of the coral Acropora tenuis. Scientific Reports, 7: 44101. doi:10.1038/srep44101
- Wilkinson, A., Collier, C., Flores, F., Langlois, L., Ralph, P., Negri, A (2017). Combined effects of temperature and the herbicide diuron on Photosystem II activity of the tropical seagrass Halophila ovalis. Scientific Reports, 7: 45404. doi:10.1038/srep45404
- Humanes, A., Fink, A., Willis, B., Fabricius, K., de Beer, D and Negri, A (2017). Effects of suspended sediments and nutrient enrichment on juvenile corals. Marine Pollution Bulletin, 125: 166-175. doi:10.1016/j.marpolbul.2017.08.003
- Rocker, M., Francis, D., Fabricius, K., Willis, B., Bay, L (2017). Variation in the health and biochemical condition of the coral Acropora tenuis along two water quality gradients on the Great Barrier Reef, Australia. Marine Pollution Bulletin, 119: 106-119. doi:10.1016/j.marpolbul.2017.03.066
- Collier, C., Ow, XY., Langlois, L., Uthicke, S., Johansson, C., O'Brien, K., Hrebien, V and Adams M (2017). Optimum Temperatures for Net Primary Productivity of Three Tropical Seagrass Species. Frontiers in Plant Science, 8. doi:10.3389/fpls.2017.01446
- Collier, C., Langlois., Ow, Y., Johansson, C., Giammusso, M., Adams, M., O'Brien, K and Uthicke S (2018). Losing a winner: thermal stress and local pressures outweigh the positive effects of ocean acidification for tropical seagrasses. New Phytologist, doi:10.1111/nph.15234
- Mellin, C., Matthews, S., Anthony, K., Brown, S., Caley, J., Johns, K., Osborne, K., Puotinen, M., Thompson, A and Wolff, N (2019) Spatial resilience of the Great Barrier Reef under cumulative disturbance impacts. Global Change Biology, 25:2431-2445. doi:10.1111/gcb.14625
- Negri, A., Smith, R., King, O., Frangos, J., Warne, M., Uthicke, S (2020) Adjusting tropical marine water quality guideline values for elevated ocean temperatures. Environmental Science & Technology, 54:1102-1110. doi:10.1021/acs.est.9b05961
- Marques, J., Flores, F., Patel, F., Bianchini, A., Uthicke, S and Negri, A (in press) Acclimation history modulates effect size of calcareous algae (Halimeda opuntia) to herbicide exposure under future climate scenarios.