 eAtlas Data Catalogue
2018
Type of resources
Topics
Contact for the resource
Provided by
Years
status
-
Key Source Reefs for Community Recovery following 2016-2017 Mass Bleaching Events (NESP TWQ 4.5, UQ)
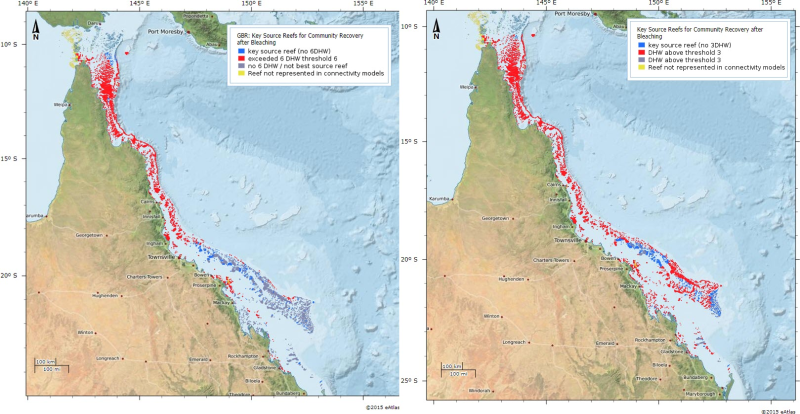
This dataset shows larval connectivities between reefs that exceeded, and did not exceed, thermal thresholds for damage during the 2016/2017 Great Barrier Reef bleaching events. The loss of reproductive adult colonies during bleaching events has the implication that coral cover recovery will require the supply of coral larvae from external sources (other reefs). Methods: Two heat-exposure analyses were performed using the two DHW thresholds of 6 DWH and 3DWH, which have been established to indicate the threshold that causes major loss of coral cover(6 DHW), and loss of the most heat sensitive coral species (3 DHW). The cumulative intensity of thermal stress is expressed as DHW in units of °C-weeks, which accumulates any thermal anomalies > 1°C above the maximum monthly mean at a location over a 12-week window. The first was an analysis to identify important source reefs for overall coral community recovery. For this analysis, all reefs on the GBR with exposure that was above 6 DHW for greater than or equal to 25% of their surface area were considered to have been sufficiently damaged by bleaching to require external larval supply for recovery (calculated from indicative reef boundaries as defined in GBRMPA zoning plan (GBRMPA, 2004)). Any reefs in this group were immediately ruled out as being a potential source reef. The second analysis identified source reefs important for recovery of the most heat-sensitive coral species. For this analysis, all reefs on the GBR with exposure that was above 3 DHW for greater than or equal to 25% of their surface area were considered to have been sufficiently damaged by bleaching to require external larval supply for recovery, and any reefs in this group were immediately ruled out as being a potential source reef. For both heat-exposure analyses, we used DHW measurements derived from satellite measured daily sea-surface temperature layers at 5 x 5 km resolution for the years 2016 and 2017, provided by NOAA Coral Reef Watch v3. Connectivity patterns over seven years for which the oceanographic patterns were available (summers of 2008-09, 2010-11, 2011-12, 2012-13, 2014-15, 2015-16, 2016-17) were used to estimate the connectivity relationships among the reefs. The larval dispersal simulations used Connie2 dispersal tool (Condie, Hepburn, & Mansbridge, 2012), which uses eReefs hydrodynamics to displace simulated larval particles. In general, the simulations followed protocols previously published by Hock et al. (2017). In the current batch of simulations, key components of larval dispersal such as spawning times and pelagic larval duration were designed so as to match dispersal of broadcast spawning Acropora (Hock et al. in prep., life history parameters based on Connolly and Baird (2010)). The resulting connectivity matrices were added to obtain a single matrix representing the cumulative supply potential over the modelled spawning seasons. The reefs have then been divided into two sets, the first set consisting of those reefs that exceeded the respective thermal stress threshold in 2016 and/or 2017, and the second set consisting of those that did not exceed the threshold. The resulting connectivity matrices were then used to identify reefs that both had the largest potential to supply larvae to each reef that exceeded the thermal stress threshold (i.e., they were important sources to damaged reefs) and at the same time also did not exceed the thermal stress threshold (i.e., their breeding stocks avoided bleaching damage caused by heat exposure above the threshold). Limitations of the Data: The Coral Reef Watch SST data layer has a resolution of 5 km2 , which is larger than many reefs on the GBR. Higher-resolution products, such as ReefTemp Next Generation, a high resolution (approximately 2 km2 ) daily product developed by the Australian Government's Bureau of Meteorology and used in Hock et al. (2017), could be better suited to reveal locations of potential thermal stress refugia. Moreover, field observations have shown that the relationship between thermal stress and subsequent mortality tends to be imperfect, as some reefs exhibited low mortality even in conditions of high thermal stress (Hughes et al., 2018). Such reefs may therefore serve as important larval sources, but cannot be identified by only taking into account SST anomalies, as was the case here. Such reefs may harbour thermally resistant corals, and/or may have had environmental cues such as pulses of warm water early in the season that prepared them to better cope with subsequent levels of thermal stress (Ainsworth et al., 2016). Format: Shapefile of important source reefs and thermally damaged reefs at 3 DHW and 6 DHW, openable in the GIS program ArcMap (Esri) or other GIS software. This is the current file of GBR reef outlines (publicly available through GBMRPA), with each reef annotated with the following categories (in the columns named DHW6 and DHW3 of the attribute table). Data Dictionary: Numerical categories in DHW6 and DHW3 columns of the attribute table of the “Key_Source_Reefs_2016-17” Shapefile. Categories: Category 2 - Reef did not experience DHW above threshold (3 or 6) in 2016 and/or 2017, and is the best source to at least one of the reefs that experienced DHW over that same threshold Category 1 - Reef experienced DHW above threshold (3 or 6) in 2016 and/or 2017 Category 0 - Reef did not experience DHW above threshold (3 or 6) in 2016 and/or 2017, but is not the best source to any of the reefs that did Category -1 - Reef not represented in connectivity models (usually small reefs close to the shore) Category -2 - Feature not relevant to connectivity models (cay, rock, island or mainland References: Ainsworth, T. D., Heron, S. F., Ortiz, J. C., Mumby, P. J., Grech, A., Ogawa, D., . . . Leggat, W. (2016). Climate change disables coral bleaching protection on the Great Barrier Reef. Science, 352(6283), 338-342 Hock, K., Wolff, N. H., Ortiz, J. C., Condie, S. A., Anthony, K. R. N., Blackwell, P. G., & Mumby, P. J. (2017). Connectivity and systemic resilience of the Great Barrier Reef. PLOS Biology, 15(11), e2003355. doi:10.1371/journal.pbio.2003355 Hughes, T. P., Kerry, J. T., Baird, A. H., Connolly, S. R., Dietzel, A., Eakin, C. M., . . . Torda, G. (2018). Global warming transforms coral reef assemblages. Nature, 556(7702), 492- 496. doi:10.1038/s41586-018-0041-2 Connolly, S. R., & Baird, A. H. (2010). Estimating dispersal potential for marine larvae: dynamic models applied to scleractinian corals. Ecology, 91(12), 3572-3583. Data Location: This dataset is filed in the eAtlas enduring data repository at: data\NESP2\4.5-Guidance-system-resilience-based-mgt
-
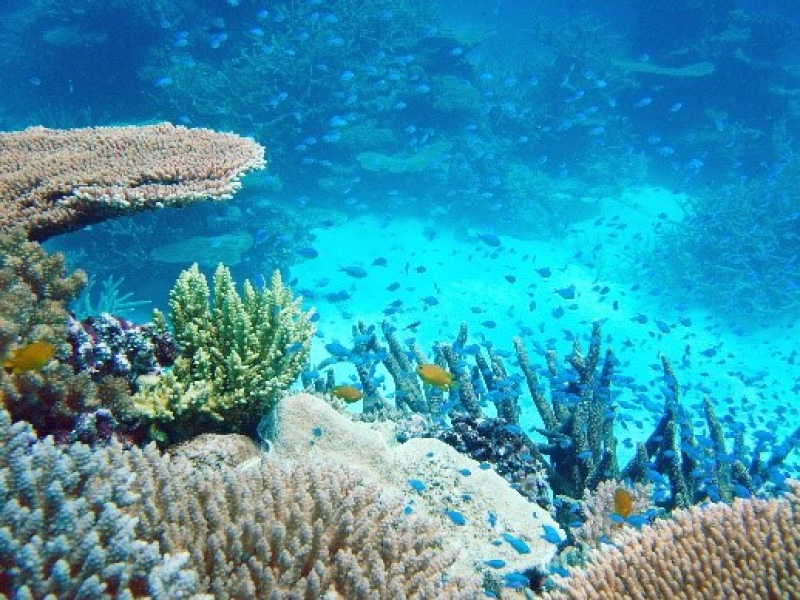
This dataset presents the raw data obtained from 1415 online and representative Australian that were asked to aesthetically rate 180 photos of typical coral reef landscapes. Mean aesthetic ratings of 180 photos were collected from the survey, as well as from an expert research team, contributing mean ratings of coral reef health, coral cover, coral pattern, coral topography, fish abundance, and visibility. Please note that CSIRO have published a version of this dataset on 29 May 2019, which should be considered the primary source of data information (i.e. citation for data files found on the CSIRO Portal). The published eAtlas version includes files supplied by the project to the eAtlas for publication. The eAtlas version differs in format (RatingsAesthetics.csv - includes the photo mean score) and includes a second spreadsheet containing information not available in the CSIRO version (Ratings-All.csv) which captures each photo's ratings against five factors (coral health, coral cover, coral topography, fish abundance and visibility), as outlined in point two below. The CSIRO version contains the SPSS data extract and codebook (xlsx file), as well as the photo ratings summary (PhotoRatingsInd.xlsx) without the calculated mean. Methods: 1. A survey was constructed to collect simple demographic information about each participant, the self-rated level of interest in coral reefs, and aesthetic ratings for each photo on a scale of 1-10 (where 1=extremely unattractive, and 10=extremely attractive). Once an individual agreed to partake in the survey, they were sent a survey with 50 photographs randomly chosen from the pool of 181 photographs. It was noted that the quality of responses could be affected if more than 50 photos were viewed (where 50 photos represented a ten-minute survey). The style of the survey was not dissimilar from very popular online games in which individuals are asked to rank aesthetic preferences of fashion or interior design items. A full list of the images used in the survey is available in Appendix 1 (1-90) A total of 1,417 individuals participated in the study, where each photo was rated at least 380 times on the ten-point scale. Twenty-nine percent of the sample came from Queensland, and 71% were distributed across Australia. Some 62.3% of people came from Metropolitan Australia, whilst 37.7 came from rural/regional Australia. Some 51.4% were female. Participants represented a range of experiences with the Great Barrier Reef, where 7.2% had never visited, and 7.9% did not find coral reefs that interesting. Most participants (99.6%) were not part of a GBR based club or community groups, such as a spear-fishing club. The average age for the sample population was 46.96 (standard error=0.471), and ranged from 16 to 89. 2. We identified 180 underwater coral reef photographs from those that were publicly available (www.gbrmpa.gov.au) or existed in the combined image libraries of the study authors. They represented typical underwater images from the GBR, with a common oblique perspective taken from approximately 5-10 m above a coral substrate. This perspective characterised the image that a person would see as soon as they placed their head beneath the water, and it was similar to the visual perspective used in monitoring surveys conducted by manta-towing at the Australian Institute of Marine Science. Some photos were duplicated and placed randomly, and some were modified using photo editing software to manipulate one feature independent of others, for the purposes of ‘checking’ the consistency and subtleties associated with making aesthetic judgements. Each photo was rated for each of the five factors (on a scale of low, medium, high) by members of the research team with experience in coral reefs; coral health, coral cover, coral topography, fish abundance, and visibility. Given that there were insufficient photos representing abundant fish and poor visibility, a total of 20 photos were manipulated to enhance or de-emphasise certain factors. These photos ensured that we could attribute differences in aesthetic appeal of each photo to at least one of the five factors. The final set of photos represented realistic coral reef images across all five factors, with a greater representation of images containing moderately high coral cover to capture the nuances across the scale of potential ratings and also to aide engagement during online rating sessions Format: This dataset consists of two CSV files and two PDF files. The two CSV files contain the data on aesthetic ratings from an online survey, and ratings on reef health and abundance. eAtlas Note: The original files were provided as Excel spreadsheet tables and were converted to CSV files. Photographs and analysis were originally supplied as word document files and have been converted to PDF files. References: Marshall, N.A., Marshall, P.A., and Smith, A.K. (2017) Managing for Aesthetic Values in the Great Barrier Reef: Identifying indicators and linking Reef Aesthetics with Reef Health. Report to the National Environmental Science Programme. Reef and Rainforest Research Centre Limited, Cairns (102 pp.). Data Location: This dataset is filed in the eAtlas enduring data repository at: eAtlas/nesp3/3.2.4_Defining-assessing-GBR-aesthetics