 eAtlas Data Catalogue
500000
Type of resources
Topics
Keywords
Contact for the resource
Provided by
Formats
Representation types
status
Scale
-
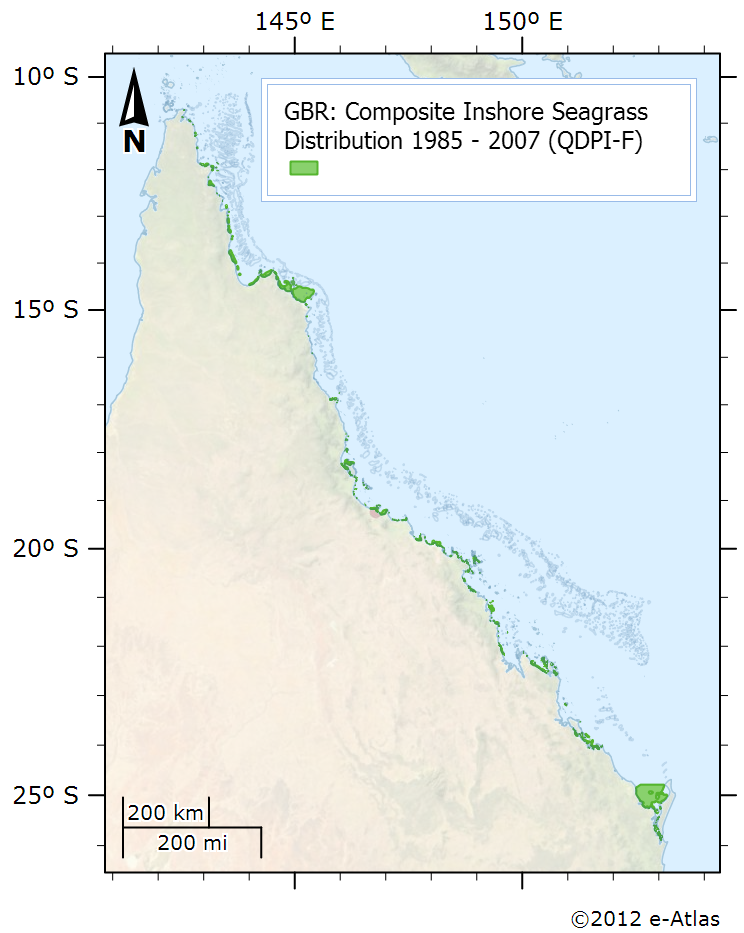
This dataset is shows the distribution of inshore seagrass along the eastern Queensland coastline. It is a composite of 38 surveys conducted from 1984 to 2007. Coastal seagrasses in waters shallower than -15 metres were mapped by dive surveys, under water cameras and inter-tidal aerial surveys. The data includes location information on the spatial extent of seagrass habitats mapped in 38 surveys between 1984 – 2007. The data does not include species information. Seagrass surveys were conducted at various times and at different precisions but the composite layer is the best depiction of seagrass for the GBRWHA and Hervey Bay presently available for planning purposes. Seagrass distribution can change seasonally and between years, and users should ensure that they make appropriate enquires to determine whether new or more appropriate information is available. Notes: This dataset is somewhat deprecated by a more recent compilation of seagrass data in 2015 that is openly available. See the related data link. Data Location: This dataset is filed in the eAtlas enduring data repository at: data\custodian\2006-2010-MTSRF\GBR_MTSRF-1-1-3_QDPI-F_Coles-R_Composite-seagrass-1984-2007
-
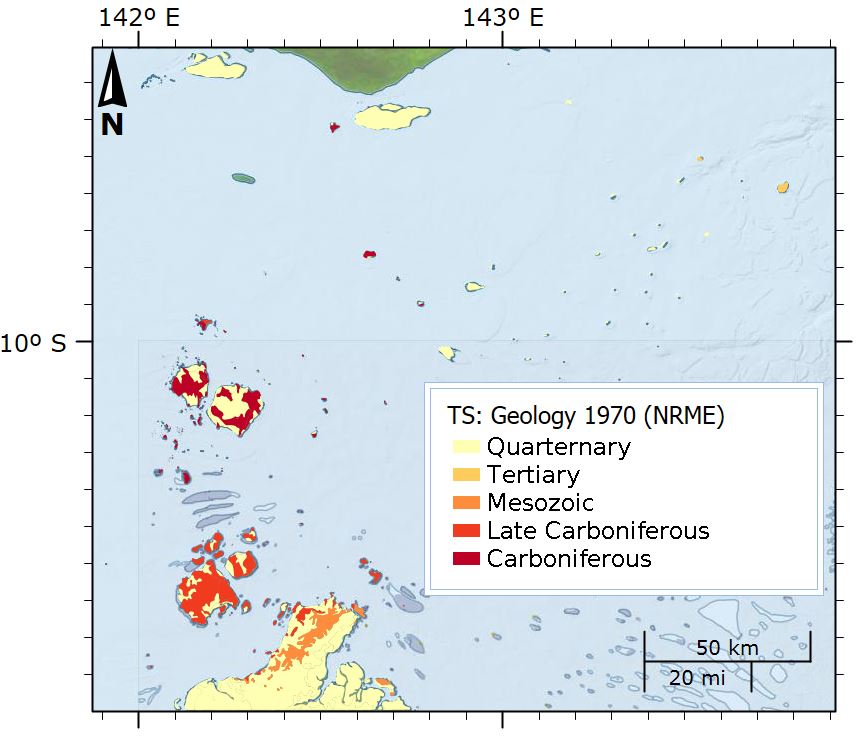
This dataset shows the geology of the Torres Strait region. The polygons in this dataset are a digital representation of the distribution or extent of geological units within the area. Polygons have a range of attributes including unit name, age, lithological description and an abbreviated symbol for use in labelling the polygons. These have been extracted from the Rock Units Table held in the Department of Natural Resources, Mines and Energy Merlin Database. The dataset was compiled in 1970 by WF Willmott (BMR), simplified from mapping in 1968 by DS Trail, WF Willmott, WD Palfreyman (B.M.R), WG Whitaker (G.S.Q.). The islands were mapped using two dinghies operating from a 45-foot chartered launch. Air photography was available for the islands, except for Stephens, Darnley, and Murray Islands, the shapes of which are consequently uncertain. For the Torres Strait Sheet geology was plotted on photoscale maps (1:50,000) made by the Royal Australian Survey Corps, and later reduced to 1:250,000 scale. For the Daru-Maer Island Sheet the geology was plotted directly at 1:250,000 scale. Data Format: Shapefile with 297 polygon features and has a range of attributes including unit name, age, lithological description and an abbreviated symbol for use in labelling the polygons. Definition source: The Rock Units Table held in the Department of Natural Resources, Mines and Energy Merlin Database. ROCK_U_NAM: The Map Unit Name of the polygon. In the case of named units it comprises of the standard binomial name. Unnamed subdivisions of named units include the binomial name with a letter symbol as a suffix. Unnamed units are represented by a letter symbol, usually in combination with a map sheet number. AGE:Geological age of unit (Quarternary, Tertiary, Mesozoic, Late Carboniferous, Carboniferous) LITH_SUMMA: Provides a brief description of the map units as they have been described in the course of the project work, or as has appeared on relevant hard copy map legends. * Basalt lava and tuff * Coastal marine deposits: saltpans, mangrove swamps, lagoonal deposits; sand, mud * Clay, silt, sand, gravel; flood plain alluvium * Leucocratic and porphyritic biotite granite, hornblende-biotite adamellite, granodiorite * Rhyolitic welded tuff, rhyolite, agglomerate, volcanic breccia, andesite, siltstone, arenite * Porphyry * Residual and colluvial soil, sand, gravel, rubble, some semi-consolidated material * Lithics and crystal-rich rhyolitic ignimbrite; volcanic rudite and breccia; rhyolite; andesite; some volcaniclastic sedimentary rocks * Lithics and crystal-rich dacitic to rhyodacitic ignimbrite; tuffaceous siltstone, sandstone * Crystal-rich rhyolitic ignimbrite; rhyolite; volcaniclastic rudite * Sandstone, conglomerate and shale * Younger dune sand and some minor older dune sand with dune ridges ROCK_U_TYP: Provides a means of separating map units, eg for constructing a map reference. This item will contain one of the following: * STRAT- Stratigraphic unit, including sedimentary, volcanic and metamorphic rock units. * INTRU- Intrusive rock units; * COMPST- Compound unit where the polygon includes two or more rock units, either stratigraphic, intrusive or both; * COMPST- Compound unit, as above where the dominant or topmost unit is of the STRAT type; * COMPIN- Compound unit, as above, where the dominant unit is of the INTRU type; * WATER- Water bodies- Large dams, lakes, waterholes. SEQUENCE_N: A numeric field to allow sorting of the rock units in approximate stratigraphic order as they would appear on a map legend. DOMINANT_R: A simplified lithological description to allow generation of thematic maps based on broad rock types. * BASALT * MISCELLANEOUS UNCONSOLIDATED SEDIMENTS * ALLUVIUM * GRANITOID * FELSITES (LAVAS, CLASTICS & HIGH-LEVEL INTRUSIVES) * COLLUVIUM * SEDIMENTARY ROCK * SAND MAP_SYMBOL: Provides an abbreviated label for polygons. Mostly based on the letter symbols as they appear on published maps or the original hard copy compilation sheets. These are not unique across the State, but should be unique within a single map tile, and usually adjacent tiles.
-
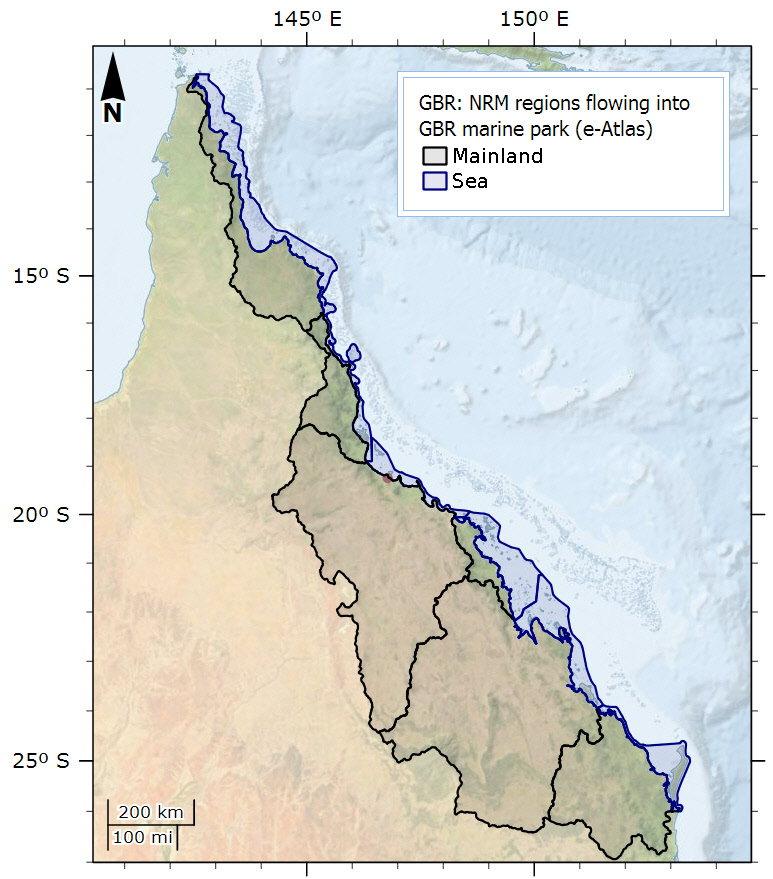
This dataset corresponds to the Natural Resource Management (NRM) Regions corresponding to river catchments neighbouring the Great Barrier Reef Marine Park. The original aim of this dataset was to show river basins that flow into the Great Barrier Reef (GBR) Marine Park, grouping them by their NRM region. The NRM region boundaries already mostly correspond to a grouping of river basin boundaries and so this regrouping of river basins was unnecessary. The NRM regions did however need some adjustments as they extend out to sea and the Cape York NRM region covers river basins on the east and west coast of Cape York and thus contains river basins that do not flow into the GBR. For this reason the Cape York NRM region was split along the Great Dividing range to remove the western catchments so that only eastern catchments were kept. In addition to this the NRM region polygons were split into the mainland and sea areas to allow this dataset to be used for easy map creation. Because of these changes the polygons in this dataset do not correspond to the NRM boundaries, but are based on the NRM boundaries. Since 2006, NRM regions have been important in the delivery of Australian Government funding initiatives including Caring for our Country, the Natural Heritage Trust, the National Landcare Program, the Environmental Stewardship Program and the Working on Country Indigenous land and sea ranger program. The NRM regions included in this dataset: Burnett Mary, Fitzroy, Mackay Whitsunday, Burdekin, Wet Tropics and Cape York (eastern half). Since this dataset was only including catchments neighbouring the marine park it does not include the Torres Strait NRM region and only includes the eastern half of Cape York. The NRM regions were split into mainland and sea features using the Australian Coast 100k 2004 dataset. This dataset was created for the eAtlas and is not an authoritative source of the NRM boundaries. It should be used for research or display purposes only. It should be noted that from time to time the states and/or territories may revise their regional boundaries in accordance with local needs and therefore alterations to either the attribution or boundaries of the data may occur in the future. This dataset was derived from River Basins 1997 (Geoscience Australia), NRM Regions 2012 (Department of Environment) and Australian Coast 100k 2004 (Geoscience Australia) datasets. Processing: Using ArcMap a copy of the NRM regions shapefile was made (NRM_Regions_2012_GBRMP) and editing enabled. The NRM regions of interest were selected. This selection was then inverted to select all the features we didn't want to keep. These were then deleted. The River Basins 1997 dataset was loaded into ArcMap and a transformation was chosen to convert the ADG66 data into GDA 94. The coast was checked against the Coast 100k dataset to ensure the transformation was correct. The Cape York NRM region was split in two by tracing the catchments along the Great Dividing range based on the River Basins 1997 (Geoscience Australia) dataset. The tip of the eastern side basin of Cape York was drawn to the boundary vertically. The western side was then selected and deleted. The Coast 100k 2004 dataset was added and an a Definition Query was setup to only keep the mainland features ("FEAT_CODE" = 'mainland'). This was then used to split the NRM_Regions_2010_GBRMP using the Split Polygons tool from the Advanced Editing menu. A new attribute (FEAT_CODE) was then added to the shapefile to indicate if the feature was part of the mainland ('mainland') or part of the marine boundary ('sea'). The Shape_Area attribute was renamed to SHAPE_Area by removing and recreating it. Also Leng_Units and Area_Units was added as text fields. The Data Frame projection was changed to GDA 1994 Australia Albers equal area projection for recalculate the Shape areas and length. This was done using the Calculate Geometry tool. The The AREA_DESC attribute was removed as it no longer made sense. The shapefile was then renamed to GBR_eAtlas_NRM_Regions_2012_GBRMP.shp. NRM_Regions_2012_GBRMP: Natural Resource Management (NRM) Regions (2012), Australian Government Department of the Environment, ERIN DIG, Available from http://www.environment.gov.au/fed/catalog/search/resource/details.page?uuid=%7BD92421DF-37D9-4194-854C-FBD123747A71%7D