GBR sampling site, coral & SST plots

©
Description
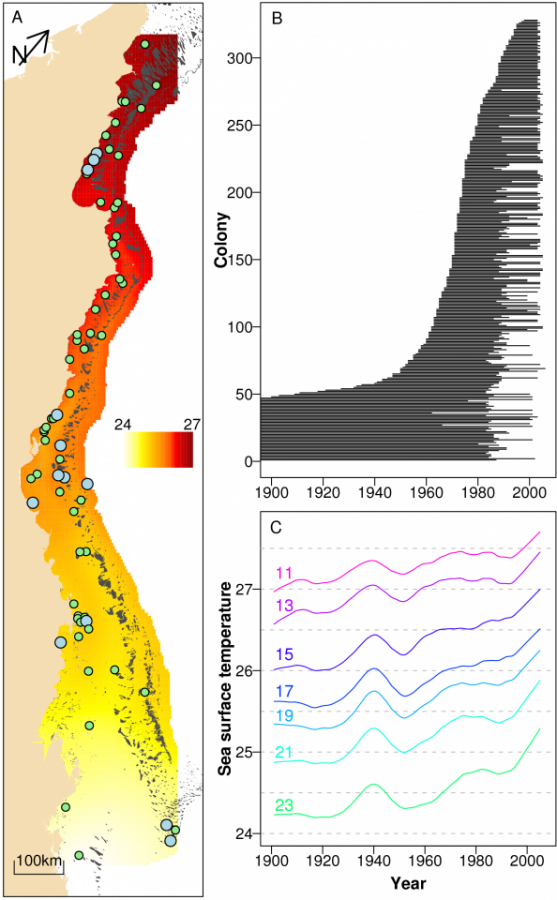
(A) Map of the Great Barrier Reef, showing locations of the sampled reefs and large-scale spatial patterns in SST averaged over the last 105 years (ºC). Blue symbols indicate the 13 reefs with Porites cores sampled in 2005, and green symbols indicate the 56 reefs sampled before 1993. (B) Distribution of age ranges of the 328 Porites colonies. Truncated records extend back in time as far as 1572. (C) Temporal trends in annual SST for 2-degree latitudinal bands (labeled with colored numbers, ºS) in the Great Barrier Reef.


