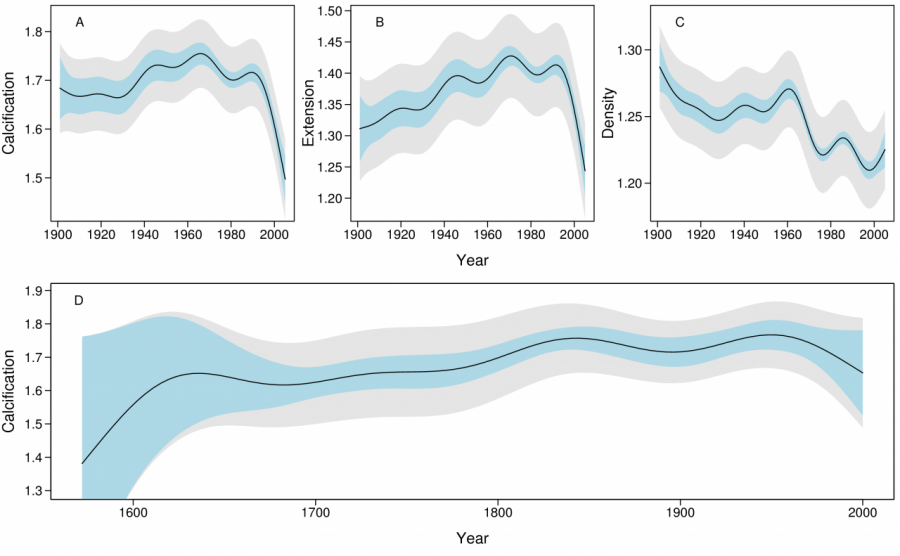
Plots of porites threats effects

©
Description
Partial effects plots showing the variation of calcification (g cm-2 yr-1), linear extension (cm yr-1) and density (g cm-3) in Porites over time. Plots A - C are based on 1900 - 2005 data for all colonies, and plot D on data for the 10 long cores. Light blue bands indicate 95% confidence intervals for comparison between years, and gray bands indicate 95% confidence intervals for the predicted value for any given year. Calcification declines by 14.2% from 1990 - 2005 (A), primarily due to declining extension (B). Density declines from 1900 onwards (C). The 1572 - 2001 data show calcification increased weakly from ~1.62 prior to 1700 to ~1.76 in ~1850 after which it remained relatively constant (D) prior to a weak decline since ~1960.


