Wind and coral damage
Image
Licence
©
All rights reserved
Description
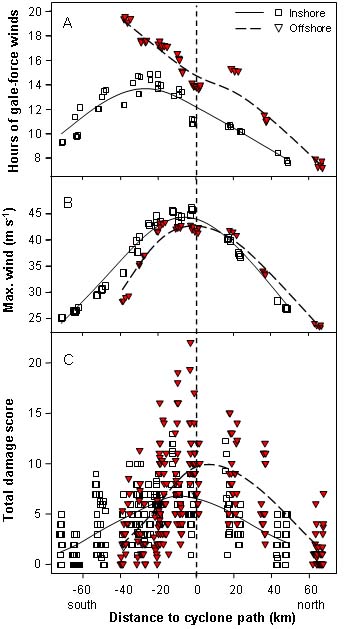
(A) Spatial gradients in the number of hours of gale-force winds (10-min averaged maximum wind speed ≥17 m s-1), and (B) 10-min averaged maximum wind speed at each site plotted against distance to the cyclone path. (C) Total damage scores (sum of 7 damage categories) of individual transects as a function of distance to the cyclone path.