
COTS Summary
Image
Licence
©
All rights reserved
Description
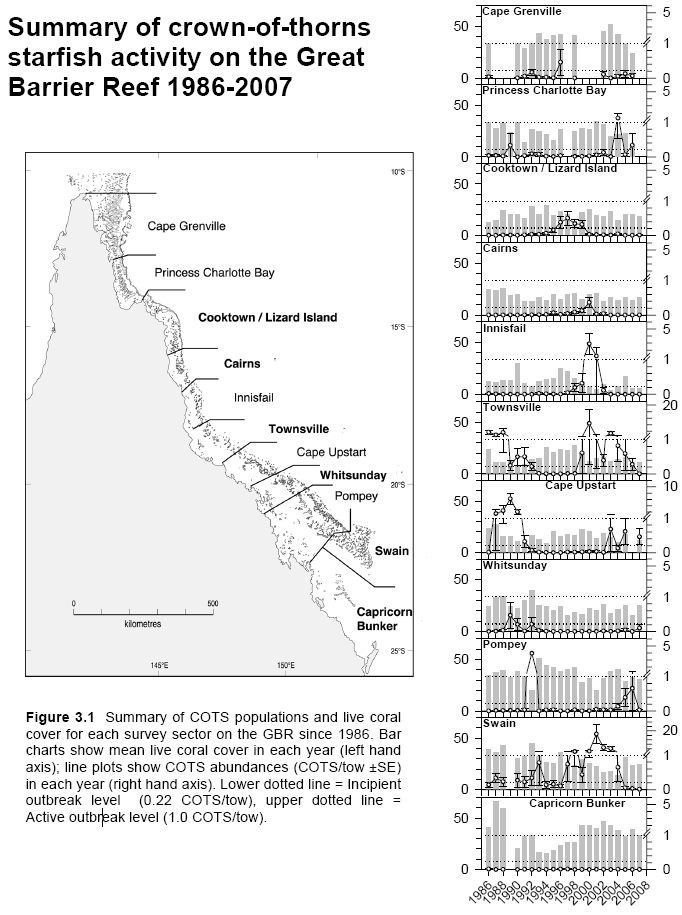
Summary of COTS populations and live coral cover for each survey sector on the GBR since 1986. Bar charts show mean live coral cover in each year (left hand axis); line plots show COTS abundances (COTS/tow ±SE) in each year (right hand axis). Lower dotted line = Incipident outbreak level (0.22 COTS/tow), upper dotted line = Active outbreak level (1.0 COTS/tow).