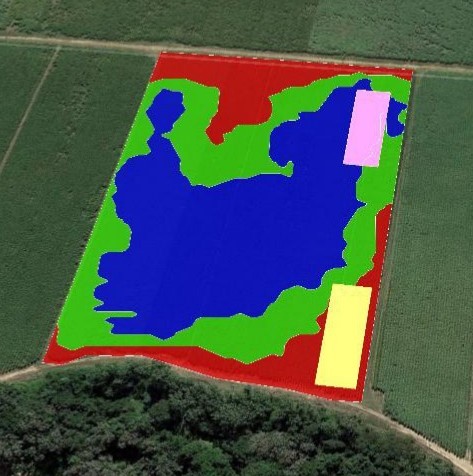
Yield maps can be used to identify trial sites with contrasting fertilizer N requirements

Photographers: John Turner
Description
This is an example of using measured variability in crop performance across a cane field to test whether productivity zones can receive different fertilizer N application rates. The yield maps allow experiments to be located in parts of the field with similar productivity and N demand.
Image produced for the project


