
Time Series Chlorophyll Turbidity: Dunk Island
Image
Licence

Description
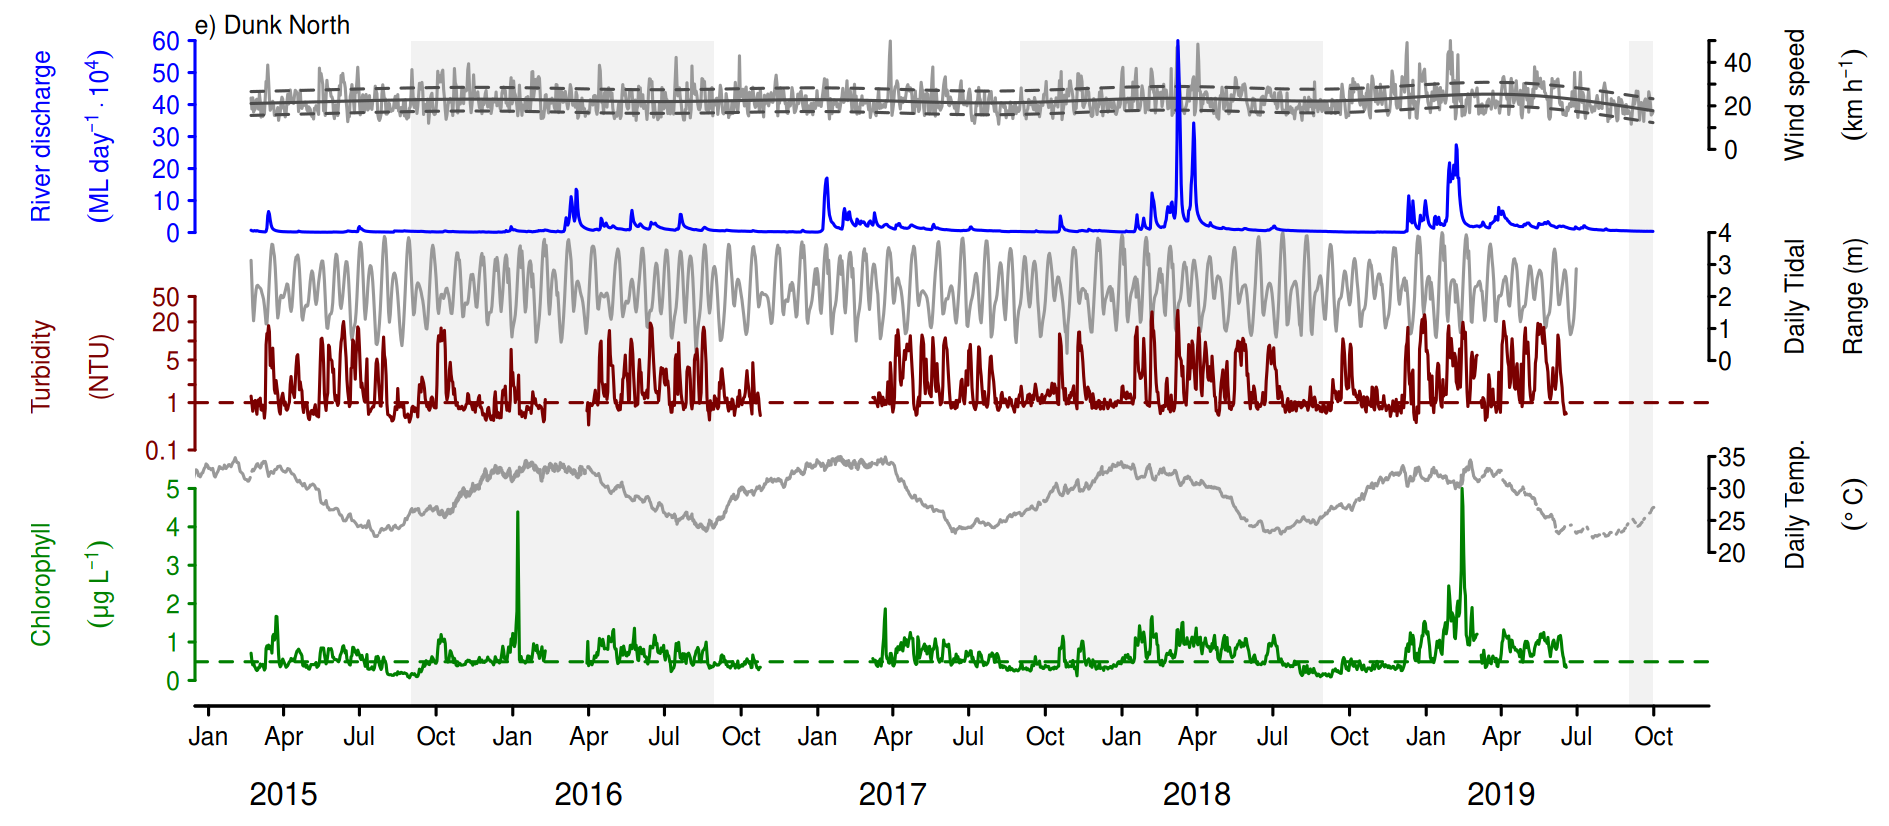
Time-series of turbidity (brown line) and chlorophyll concentrations (green line) measured by the Dunk North logger. Additional panels represent daily freshwater discharge from nearby rivers (blue line), wind speeds, tidal range, and daily temperature. Horizontal dashed lines show the GBR Water Quality Guidelines for turbidity and chlorophyll. The large peak in chlorophyll in Feb 2019 occurred following flood events in early Feb. For further details, see the Marine Monitoring Program: Annual report for inshore water quality monitoring 2017-18 available at http://hdl.handle.net/11017/3490