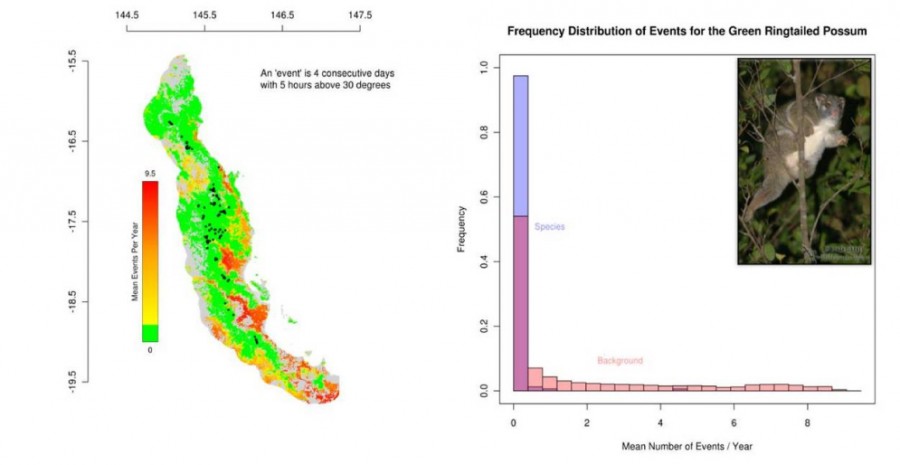
Example of an animal distribution map

© courtesy Justin Welbergen (JCU)
Description
An example of an accurate high-resolution map of the temperature extreme exposure of a key representative Wet Tropics animal species. It shows the occurrence records of the green ringtail possum (Pseudochirops archeri) (black dots) overlaid on a map of the annual probability that the maximum temperature in the possum’s preferred microhabitat (i.e. canopy) exceeds 30 C for more than 5 hours per day for more than 4 consecutive days (a critical thermal regime for the possums - Krockenberger et al 2011). Right: Plot showing that the species is found almost exclusively in locations where the temperature in the canopy does not exceed this critical thermal regime.


