
Wet Tropics thermal exposure
© courtesy Justin Welbergen (JCU)
Notes
Will likely be used for scientific publication.
Description
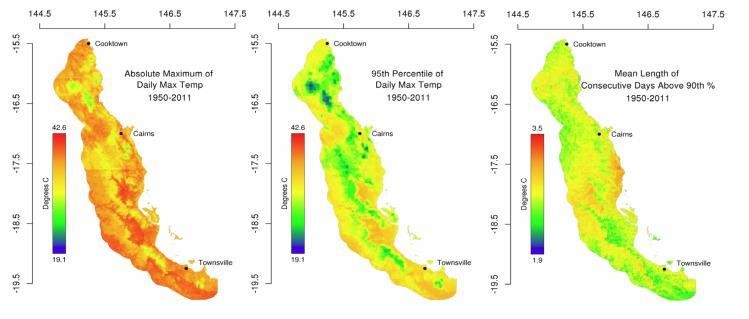
Spatially-explicit examples of thermal extremes' exposure in the Wet Tropics at the landscape scale.
Left: The absolute maximum daily Tmax;
centre: the 95th percentile of daily Tmax;
right: the mean length of consecutive days above the 90th percentile.