Microhabitat temperature downscaling procedure

Description
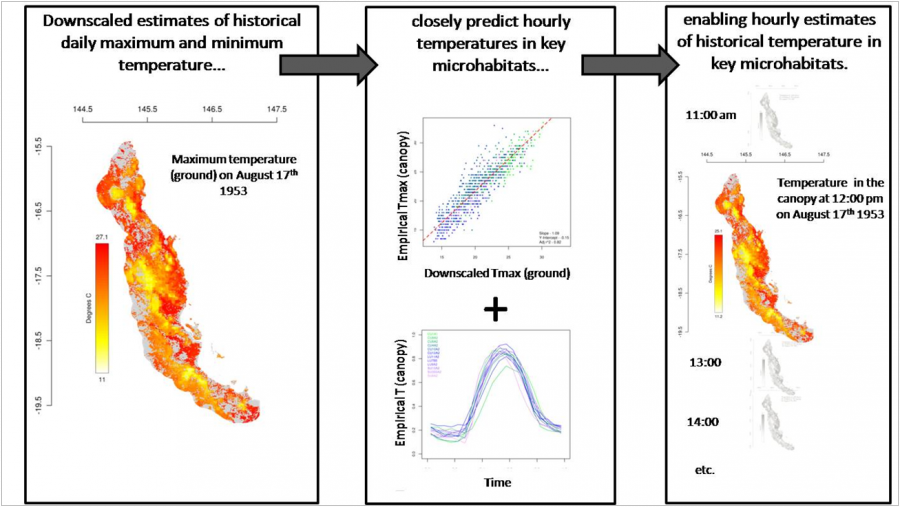
Schematic representation of our approach for quantifying the thermal exposure as experienced in key microhabitats (canopy, litter, surface, soil, logs) (objective 1b). By linking our downscaled estimates of daily max and min temperature (objective 1a) to empirical microhabitat-specific hourly temperature curves (a), we can produce highly accurate estimates of hourly temperatures in the key microhabitats across the Wet Tropics, for example the temperature at 19 meters under the canopy at 12 pm on August 17th, 1953 (b).


