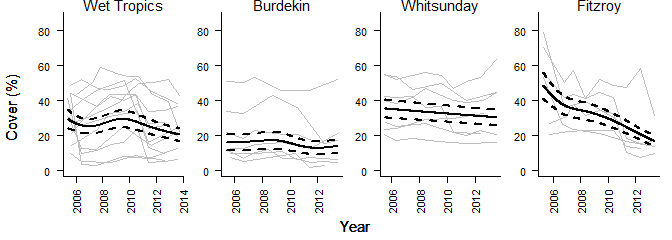
Graphs showing hard coral cover trends for the Wet Tropics, Burdekin, Whitsunday, Fitzroy regions

©
Description
Regional trends in hard coral cover. Bold black curve represents the predicted regional trend bounded by blue dashed lines depicting the 95% confidence intervals of that trend. Grey lines show observed trends for each reef.


