

Time Series Chlorophyll Turbidity
Image
Licence
©
courtesy
Dr Britta Schaffelke (Australian Institute of Marine Science)
Description
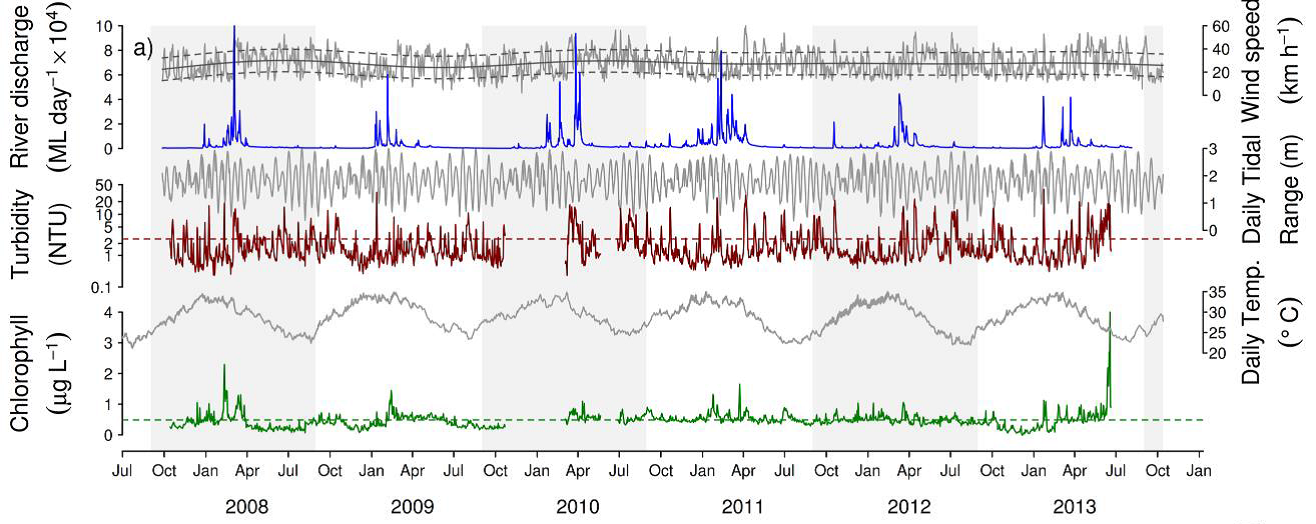
Time-series of turbidity (brown line) and chlorophyll concentration (green line) measured by the Snapper North logger. Additional panels represent daily freshwater discharge from nearby rivers (blue line), wind speeds, tidal range, and daily temperature. Horizontal dashed lines show the GBR Water Quality Guidelines values for turbidity and chlorophyll.