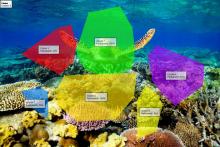
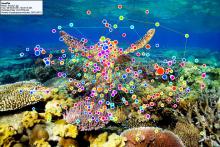
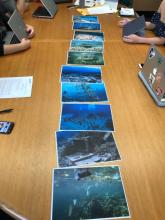
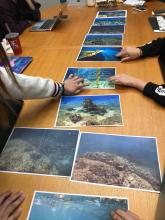
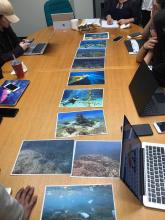
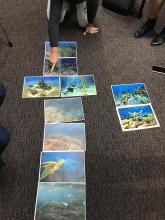
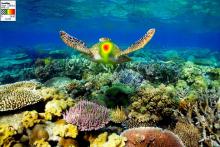
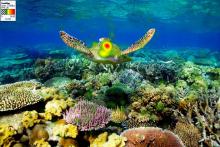
NESP TWQ Round 5 - Project 5.5 – Measuring aesthetic and experience values using Big Data approaches

Region map

This research project responded to the urgent need of understanding how ecological changes affect the aesthetic value and the user experience of the Great Barrier Reef, and how these are measured and monitored in a cost-effective way. The research capitalised on two major trends, namely peoples’ ability and willingness to share large amounts of information through various online platforms, and rapid development in computing technology to store, process and interpret these data.

NESP TWQ Project Page

Images

Datasets

29 November 2021

The last stream within the NESP 5.5 project was related to the conduct of an online survey to get aesthetic ratings of additional 3500 images downloaded from Flickr to improve the Artificial Intelligence (AI)-based system recognising and assessing the beauty of natural scenes, which had been developed in the previous NESP 3.2.3 project. Despite some earlier investment into this research area, there is still a need to improve the tools we use to measure the aesthetic beauty of marine landscapes.

10 March 2021

The second stream within the NESP 5.5 project was conducted using eye-tracking technology to examine possible differences between three participant groups in evaluating the aesthetic beauty of GBR underwater sceneries. This research continue the efforts initiated in the previous NESP 3.2.3 project to explore the power of eye-tracking as an objective measure of human aesthetic assessment of GBR underwater sceneries.

10 March 2021

Organizing focus groups was used as an effective qualitative research method to examine collective opinions of participants on a specific topic. Within NESP 5.5 project, focus groups consist of an exploratory study to explore the psychological antecedents of human aesthetic assessment of underwater sceneries at the GBR among three groups of different cultural backgrounds: Chinese, non-indigenous Australians and First People Australians. Focus group folder contains one dataset report, and three folders (Australian, Chinese, First People) with seven images.

Methods: