Description
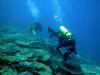
Middle reef coral
Middle Reef has been exposed to frequent disturbances since surveys began in 1993. Coral cover and coral diversity has been remarkably resilient to high temperatures, freshwater and high sediment loads. Middle Reef is more resilient to bleaching than other reefs around Magnetic Island and the corals are adapted to warm average temperatures. Sediments have high levels of organic carbon and nitrogen. Wave damage from cyclones is a minor threat. However rainfall associated with cyclones or summer low pressure systems can result in exposure to low salinities and long periods of turbidity. Recent outbreaks of atrematous necrosis on Magnetic Island suggest coral disease could be a new risk to Middle Reef. Assessments of the status of Middle Reef in 2010 were postitive (Thompson et al, 2010), based on observed levels of community attributes against estimates of expected change derived from a coral growth model (Thompson and Dolman 2010).
Description
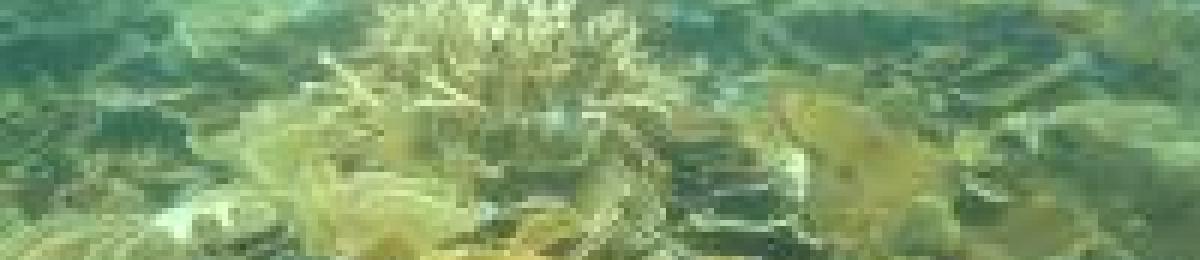
Map of Middle Reef located between Townsville and Magnetic Island
1998-2002 was a time of intense disturbance for inshore reefs on the Great Barrier Reef between Townsville and Cairns. Declines at Middle Reef occurred in all coral families and soft corals. Evidence suggests high sea water temperatures were the main cause of decline. Soft corals have not recovered. 2002 -2007 was predominantly a time of recovery for hard coral. Coral cover reached it’s maximum during the survey period of 45% in 2007. In 2009 coral cover declined to 37% with small declines in most genera except Goniopora sp. Flood plumes or associated sediment are believed to be responsible. Macroalgae increased slightly during periods of low coral cover but is currently around 1%.
Physical Setting
Middle Reef is small near-shore reef in the Great Barrier Reef complex. It is situated in the channel between Magnetic Island and the coast, just 6km from the city center of Townsville. Townsville and the coastal aspect of Magnetic Island are in Cleveland Bay, a shallow, partly enclosed estuary. The closest river system is Ross River, the mouth of which is 7km to the south of Middle Reef. It has a dam upstream which supplies Townsville’s water. Significant flow of freshwater only occurs during extreme rainfall events. High flows from the Burdekin River, 80km to the south, create long-lived flood plumes with high suspended solids and low salinity (Furnas, 2003). Ross River is primarily influenced by urban development and grazing, while the Burdekin is heavily modified by agriculture in the lower reaches. The port of Townsville, the largest in north Queensland is just 6 km away.
Tucked between the Magnetic Island and the mainland, Middle Reef has no exposure to ocean swell and little exposure to wind-driven waves. The sheltered environment leads to the accumulation of fine sediments, which are frequently re-suspended by wind and currents. The reef is surrounded by shallow water and average water temperature is several degrees higher than for offshore reefs.
Reef Communities
The Australian Institute of Marine Science has been monitoring fish and coral communities at Middle Reef since 1993. Data from fish communities is very limited as turbid conditions prevent the use of standard survey methods. Coral is measured regularly at permanently marked sites on the reef, as part of the reef monitoring program which surveys 47 reefs bi-annually (Sweatman et al, 2008). One site is surveyed in alternate years by the Reef Rescue Marine Monitoring Program (Thompson et al, 2010)
Middle Reef was included in surveys that reported on the status of inshore reefs in 2004 (Sweatman et al, 2007). At that time, both coral cover and species diversity was higher has higher than average. Approximately 80 species of hard corals were recorded, a result that was confirmed by Brown et al (2010).
|
Reef Status 2004 from Sweatman et al (2007). Hard coral cover was high at 51% and dominated by large colonies of Goniopora (63% of hard coral cover, with 43% of Goniopora colonies >1 m size), and Pachyseris speciosa (17% of hard coral cover, with 36% of Pachyseris colonies well >1 m in size). The majority of coral colonies (81%) were under 50 cm in size, most likely a factor of available space between these enormous colonies of Goniopora spp and Pachyseris spp. Recruit density was average with the majority of recruits (<10 cm size) of the genus Acropora (24%), Favia (16%) and Turbinaria (10%), suggesting the potential for a slight diversification of the community as these colonies grow. The Reef Rescue Marine Monitoring Program monitoring assessments up to 2009 reported Middle Reef as having positive status, due to neutral scores for hard coral cover, and positive scores for juvenile density and low macroalgal cover. (see report for full details - Thompson et al, 2010). |
Trends in Benthic Communities (LTMP)
Description
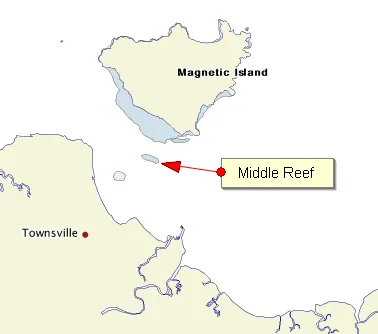
Trends in benthic cover
Recent trends in the benthic community at Middle Reef (LTMP)
Hard coral cover at Middle Reef dropped from its highest level of 45% in 2007 to 38% in 2009. The persistent flood plume during February 2009 may have contributed to the loss of hard coral, as low salinities were recorded nearby and bleaching was observed by other researchers. The decline in hard coral cover in 2009 reflected the loss of Acropora spp. cover with a 6% drop recorded. Poritidae increased in cover between 2007 and 2009 by 3%. These trends are converse to those reported in Brown et al (2010), due most likely to their data being collected shallower on the reef edge.
The 2002 bleaching event was a likely contributing factor to the steady decrease of hard and soft coral cover between 1999 and 2002. Recovery of hard coral cover following 2002 was steady until 2007, while the soft coral has remained very low (1-5%). In 2009 the hard coral assemblage were dominated by Goniopora spp. (19%) from the Poritidae family, followed by Montipora spp and Pachyseris spp. (5% each). Variation in algae cover has reflected changes in hard coral cover throughout the survey period. Turf algae dominated the benthos between 2001 and 2004. Algae cover was again approaching hard coral cover levels in 2009 with 32% recorded. The cover of macroalgae has remained low with slightly higher values in 1993 (10%) and 2004 (7%). Partial bleaching was recorded on individual colonies of Goniopora spp. in 2009.
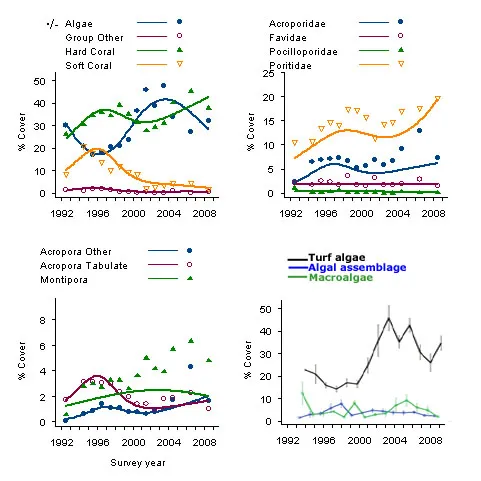
Description
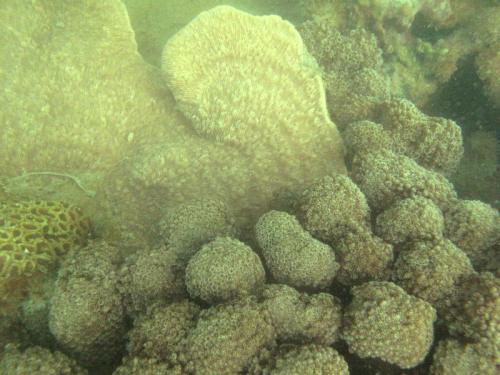
This community is found at the limit of reef development around 4m. Three genera are pictured. Gonipora, Podobacia and Favia.
Description
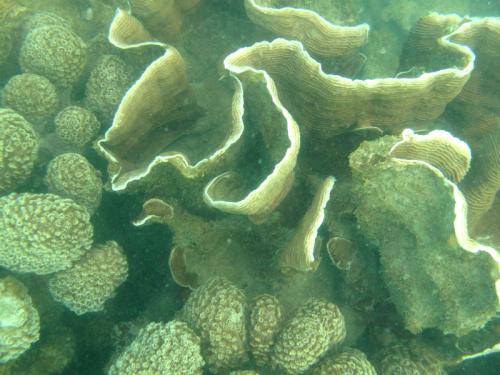
A Pachyceris colony. Parts of the colony where sediment has settled has died.
Coral Bleaching
The first record of coral bleaching for the Great Barrier Reef and Magnetic Island was in 1982 (Collins – Fringing Reefs of magnetic Island). Coral bleaching at Middle Reef was extensive in 1998. Video filmed in May and August, 1998 showed colonies bleached in May had recovered by August. There was no decline in coral cover the following year. Short video of bleaching at Middle Reef .
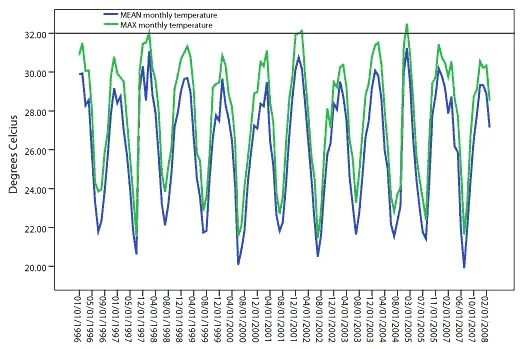
The best predictor of coral bleaching is maximum monthly temperature (Berklemans, 2009), which was 32 degrees for Middle Reef in 1998. The 32 degree threshold was exceeded in 2002 and bleaching was widespread on reefs around Magnetic Island. Coral decline between 1999 and 2002 was 10 percent. The threshold was again reached in 2005 without any observed bleaching or coral decline.
Description
Monthly mean and maximum water temperature on Middle Reef
Temperature alone, may not be a good predictor of bleaching if other stressors or modifiers are present. The high turbidity at Middle Reef may be a factor in the ability of coral to withstand high sea water temperatures. Light attenuation curves indicate that light penetration at Middle Reef is commonly reduced by >70% within 2 m of the surface on days of average turbidity (Brown et al, 2010). High sediment loads can protect corals from bleaching mortality, by reducing exposure to UV and potentially providing a food source (Anthony et al, 2007)
Freshwater inundation and runoff
Previous records of coral mortality due to freshwater inundation are associated with cyclones and river flood plumes. Shallow reefs in the Great Barrier Reef Marine Park Keppel Island region suffered almost complete mortality due to prolonged salinity stress following the 1991 Fitzroy River floods, and 50 per cent of the fringing reefs around Great Barrier Reef Snapper Island were killed by freshwater flood run-off in 1998.Freshwater inundation is a threat to Middle Reef due to its shallow reef development, with 76% of the reef area occurring between zero and three meters LAT (Brown et al, 2010). The high turbidity means coral growth is most abundant in shallow water. Freshwater forms a lens on the sea surface, with shallow corals being most exposed.
Flood plumes from the Burdekin River typically move along the coastal zone from south to north (Furnas 2003). Plume modelling indicates low salinity events that last 24 hours are expected every year and events where river water content exceed 15% (a 30 ppt event or less) every 5 to 10 years (King et al, 2002). Salinity at 2m in Cockle Bay, a few hundred meters from Middle Reef was less than 20ppt in February 2009 (Chin, MTSRF 4.8.4s).
Flood plumes pose additional threats to the corals of Middle Reef in exposure to nutrients and reduced light levels due to high suspended sediment loads. Fine sediments are typically associated with higher levels of organic carbon and nitrogen and this is the case at Middle Reef. (Thompson et al, 2010).
Coral disease
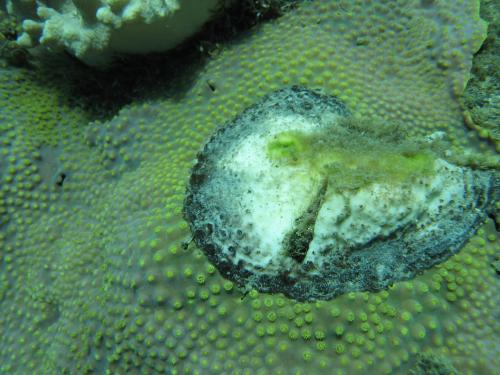
The most common disease detected in surveys was ‘atramentous necrosis’, where blackened lesions are found on the colony surface. Lesions are known to form around small depressions in the colony surface which are sites of sediment accumulation. At other sites on Magnetic Island, this disease has been associated with high water temperatures (Jones et al, 2004). Surveys at Middle Reef take place in winter. Therefore the role of disease in coral mortality is likely to be underestimated.
Description
Atrematous necrosis on a Turbinaria colony
References
- Anthony KRN, Connolly SR Hoegh-Guldberg O (2007) Bleaching, energetics, and coral mortality risk: Effects of temperature, light, and sediment regime, Limnology and Oceanography 52:
- Berkelmans R (2009) Bleaching and Mortality Thresholds: How Much is Too Much? thresholds: How much is too much? In: Coral Bleaching: Patterns, Processes, Causes and Consequences (MJH van Oppen and JM Lough eds) Ecological Studies 205, Springer-Verlag, Berlin Heidelberg:103-119.
- Brown NK, Smithers SG, Perry CT (2010) Geomorphology and community structure of Middle Reef, central Great Barrier Reef, Australia: an inner-shelf turbid zone reef subject to episodic mortality events. Coral Reefs: online 10.1007/s00338-010-0640-3
- Furnas, M. J. (2003) Catchments and corals: terrestrial runoff to the Great Barrier Reef. Australian Institute of Marine Science, Townsville
- Jones RJ, Bowyer J, Hoegh-Guldberg O, Blackall LL (2004) Dynamics of a temperature-related coral disease outbreak. Mar Ecol Prog Ser 281: 63–77.
- King B, McAllister F, Done T. 2002.Modelling the impact of the Burdekin, Herbert, Tully and Johnstone River plumes on the Central Great Barrier Reef. CRC Reef Research Centre TechnicalReport No 44, CRC Reef Research Centre, Townsville.
- Sweatman, H,.Thompson, A., Delean, S.,Davidson, J. Neale, S.(2007) Status of Near-Shore Reefs of the Great Barrier Reef 2004. Marine and Tropical Sciences Research Facility Research Report Series
- Thompson A, Davidson J, Schaffelke B, Sweatman H (2010) Reef Rescue Marine Monitoring Program. Final Report of AIMS Activities – Inshore coral reef monitoring 2009/10. Report for Reef and Rainforest Research Centre. Australian Institute of Marine Science, Townsville. (100 pp.)
- Thompson A, Dolman A (2010) Coral Bleaching: one disturbance too many for near-shore reefs of the Great Barrier Reef. Coral Reefs (online).
Related content