Description
GBR divers
Background
The Great Barrier Reef (GBR) has great economic importance as well as immense aesthetic value, contributing an estimated $5.8 billion to the Australian economy, principally through tourism, and commercial and recreational fisheries. Inscription on the World Heritage List recognises the area’s global significance and entails regular reporting on its status. Coral reefs are always changing through natural processes such as recruitment, growth, mortality and disturbance by storms. Information about natural variability of populations is essential for informed management. The AIMS Long-Term Monitoring Program (LTMP), initiated in 1993, was designed to track changes in populations of key groups of organisms, particularly crown-of-thorns starfish, corals and reef fishes, on appropriate spatial scales over the length and breadth of the Great Barrier Reef World Heritage Area (GBRWHA). LTMP core reefs were surveyed annually until 2006, when the program was modified to incorporate surveys of a different set of reefs that were chosen to investigate the effects of the 2004 rezoning of the GBR Marine Park. LTMP core reefs continue to be surveyed every other year (odd years) while Representative Areas Program (RAP) reefs are surveyed in the alternate years (even years).
The specific objectives of the programs are:
- To monitor the status and changes in distribution and abundance of reef biota on a large scale.
- To provide environmental managers with a context for assessing impacts of human activities within the GBR Marine Park and with a basis for managing the GBR for ecologically sustainable use.
- To examine the effects of rezoning the GBR Marine Park on biodiversity.
Status Report no. 8 presents a synthesis of LTMP and RAP data collected up to the 2007 field season. Results from 2006 and 2007 have not previously been reported.
Methods
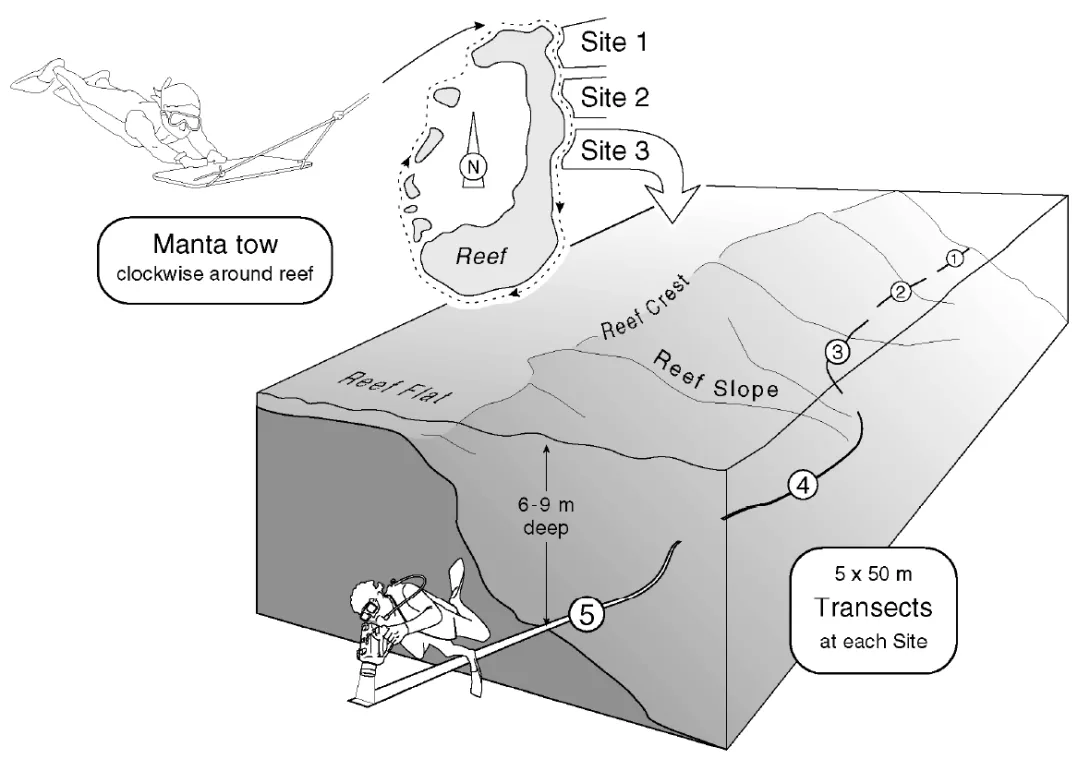
Surveys for the LTMP involve three tasks: manta tow surveys for crown-of-thorns starfish (COTS) and reef-wide coral cover (broad-scale surveys), surveys of sessile benthic organisms using underwater still images and visual counts of reef fishes.
Description
Schematic arrangement of sampling effort of core survey reefs.
Broad scale manta tow surveys have been carried out in 11 latitudinal sectors spanning the length of the GBR since 1986. The entire perimeter of each reef is surveyed using the manta tow technique, providing a reef-wide context for the intensive surveys. The primary objective of the broad-scale surveys is to detect and monitor populations of COTS on the GBR. Manta tow surveys also include estimates of percent cover of living hard coral, living soft coral and recently dead hard coral, allowing assessment of the impact of COTS outbreaks and other large-scale disturbances. In 2006 coral trout abundance became an additional manta tow survey variable to address the objectives of the RAP.
Fishes and benthic organisms have been surveyed intensively along five permanently marked 50m transects within each of three sites that run parallel to the reef crest since 1993. Sites are located at 6-9 m depth in a standardised habitat across the survey reefs. Initially, 52 “core” reefs were selected for annual LTMP surveys in six of the 11 sectors identified for manta tow, although this number has since been reduced to 46 reefs. Where possible, in each sector, three or more reefs were selected in each of three positions across the continental shelf: inshore, middle shelf and outer shelf. Not all latitudinal sectors have survey reefs in all three shelf positions. In RAP survey years, a total of 56 reefs are surveyed across 5 sectors. For this program, reefs were selected in pairs of mid-shelf and outer shelf reefs that had both been open to fishing prior to 2004, but one reef in each pair had been rezoned as a no-take area in 2004 while the other reef remained open to fishing. Only a small minority of the existing AIMS Long-term Monitoring Program survey reefs were rezoned as no-take areas in 2004. The same sampling methods are used to survey sites on different sets of reefs for each of the programs.
Benthic organisms are surveyed using still photography. In 2007 the benthic survey method was changed in that, rather than selecting frames from a continuous video record, single frames are shot at 1m intervals using a digital still camera. Fifty still frames are shot along each 50m transect with the camera held approximately 50cm above the substrate. Percent cover of corals and other benthic categories are estimated using a point sampling technique, in which approximately 200 systematically dispersed points are sampled from each video transect.
Fishes of 214 species are counted along the same permanently marked transects. Larger mobile fishes (141 spp.) are counted in a 5m wide belt transect and damselfishes (73 spp.) are counted in a 1m wide belt. Total lengths of any coral trout species (Serranidae, Plectropomus spp.) recorded within transect belts have been estimated from 1996 onwards. Length estimates of other species within the family Serranidae and of fishes within another two families frequently targeted by fishers (Lethrinidae and Lutjanidae) have been recorded since 2006.
SCUBA search surveys identifying sources of coral mortality have been conducted in conjuction with benthic surveys since the beginning of the LTMP, although the methods have continually evolved over the survey period. The variables recorded within a 2m wide belt centred on the survey tapes include COTS, COTS feeding scars, Drupella spp. associated with feeding scars, unknown scars, percentage of corals that are bleached and the numbers of colonies within five categories of coral disease.
Results
Crown-of-thorns starfish
Description
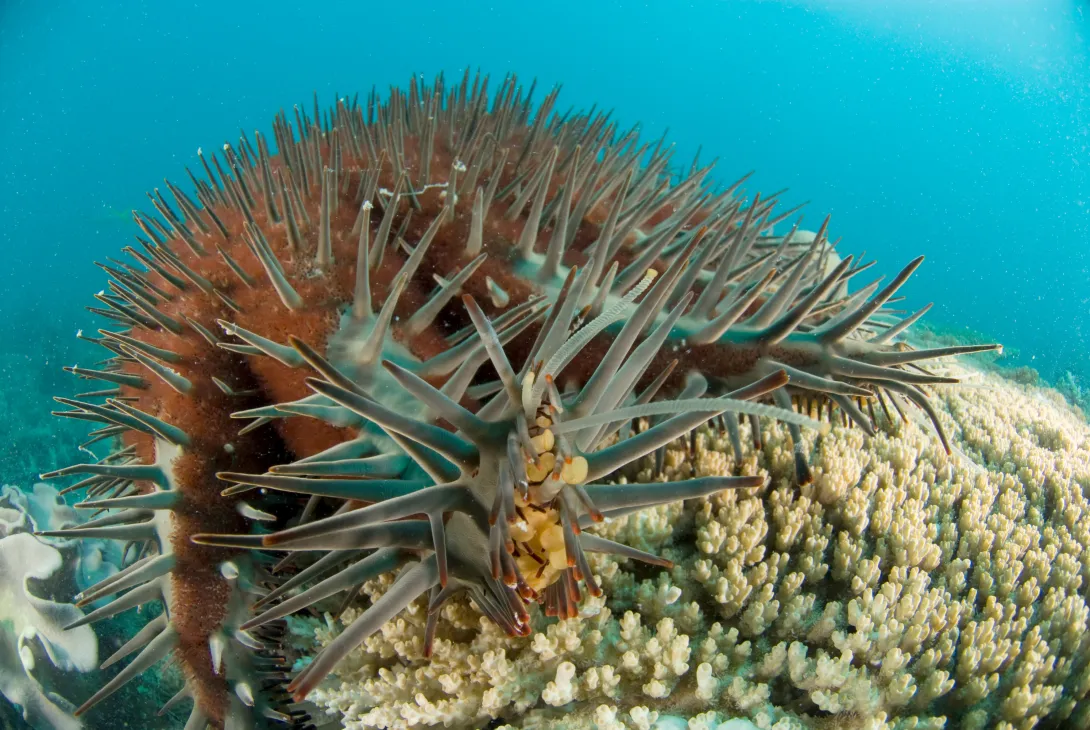
Crown of thorns starfish on coral in far north Great Barrier Reef. This COTS is on an Acropora genus coral which is one of their favorite food source.
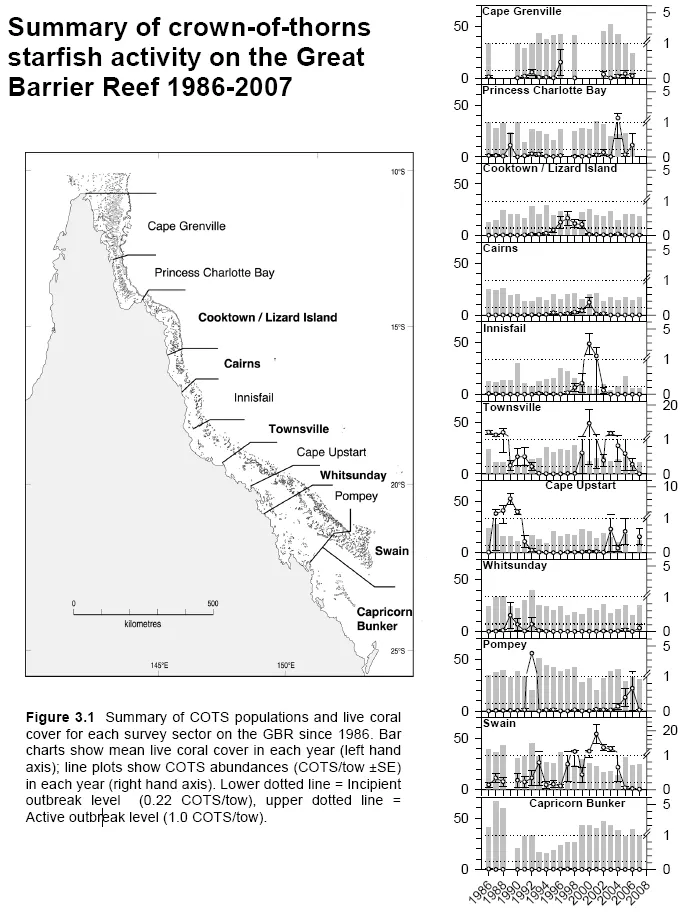
The percentage of reefs on the GBR with outbreaks of COTS has fluctuated but has been declining as the third recorded wave of outbreaks fades. There were Active or Incipient Outbreaks on 6% of the 104 reefs surveyed by manta tow in 2006 and on 4% of 98 reefs surveyed in 2007. The overall mean number of COTS per tow was 0.13 in 2006 and 0.04 in 2007. For comparison, the highest percentage of reefs with Active or Incipient Outbreaks recorded in the 21 years of surveys was 17%, recorded in 1987, 1999 and 2000 and the highest overall mean number of COTS per tow recorded during this survey period was 1.17 in 1988.
Details of the recent distribution of COTS are as follows:
- The numbers of reefs with outbreaks and the densities of COTS decreased in the Townsville, Pompey and Swain sectors between 2005 and 2007 and no Active or Incipient Outbreaks were recorded in these sectors in 2007. This is the first time that no outbreaks have been recorded in the Swain sector since surveys began in the mid 1980s.
- There were Active or Incipient Outbreaks on several reefs in the Cape Upstart sector and one reef in the Whitsunday sector in 2007, probably representing the extent of the southward drift of the third wave of outbreaks that was first seen near Lizard Is in 1993.
- Average densities of COTS increased slightly on reefs in the Cape Grenville sector and there was one reef with an Active Outbreak in the Princess Charlotte Bay sector in 2006, but these sectors were not surveyed in 2007.
- There were no significant changes in COTS densities within the other six GBR sectors.
Description
Summary of COTS populations and live coral cover for each survey sector on the GBR since 1986. Bar charts show mean live coral cover in each year (left hand axis); line plots show COTS abundances (COTS/tow ±SE) in each year (right hand axis). Lower dotted line = Incipident outbreak level (0.22 COTS/tow), upper dotted line = Active outbreak level (1.0 COTS/tow).
Coral cover
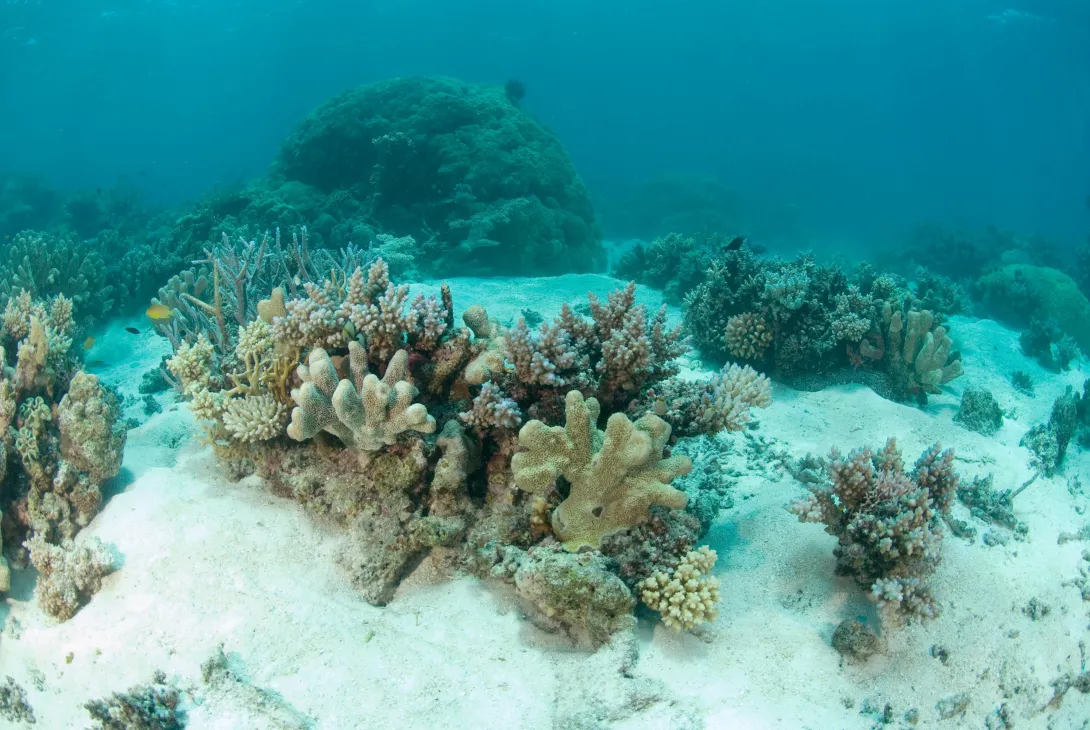
Description
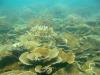
Hard coral on a sandy bottom
The salient changes on the Great Barrier Reef over the fifteen years to 2007 reflect the impact of COTS and cyclones, and to a lesser extent bleaching and disease, on reef communities and their subsequent recovery from such disturbances. Based on the 2006 and 2007 survey years, the third recorded wave of COTS outbreaks appears to be abating. There have been few cyclones and limited bleaching, indicating a period of recovery and growth. The exception is the increased reports of coral disease, particularly in regions with high coral cover.
Key results were:
- The highest mean reef-wide live coral cover in 2006 and 2007 occurred on in the outer shelf region in the Pompey sector (65% and 41% respectively), but only one reef (Ben Reef) was surveyed. Excluding Ben Reef, reefs in the Capricorn-Bunker sector had the highest mean reef-wide live coral cover (43 and 35% respectively) in these two surveys years.
- Lowest values for reef-wide live coral cover (7% and 8%) in 2006 and 2007 were found on reefs in the Innisfail sector, where large COTS populations were recorded in the recent past as well as mass bleaching in 1998. Cover on inshore reefs in the Townsville sector was similarly low (8% in each year).
- Surveys of permanent survey sites in 2007also found that cover of hard coral was highest in the Capricorn Bunker sector (55%), followed by reefs in the mid- shelf region of the Whitsunday sector (46%). These regions have been recovering from storm damage over the 15 years of intensive surveys.
- Hard coral cover on permanent survey sites was lowest on the mid-shelf reefs of the Townsville sector (12%) in 2007. Many of these reefs had been affected by COTS outbreaks in previous years, though the number of active outbreaks in the subregion has declined.
- Hard coral cover declined sharply on the permanent survey sites in the outer shelf region of the Cooktown-Lizard Island sector. Coral cover increased initially from a low level following damage by storms in the late 1980s, reaching very high values in 2000. After a period of stability, coral cover halved over the course of the past two years of surveys. Dislodged corals suggested that this was partially due to storm damage, but could also be the cumulative effect of relatively high levels of coral disease. Reefs in the subregion are dominated by tabulate Acropora spp. and have had a relatively high incidence of the coral disease white syndrome.
- Reefs in the Capricorn-Bunker sector had also been recovering from storm damage over the survey period and have had high coral cover that has been stable in recent years. These reefs are also dominated by tabulate Acropora spp.
- Hard coral cover on the permanent survey sites in the inner regions of the Cairns sector declined in the late 1990s due to coral bleaching, storms and COTS. This was followed by an increase in coral cover up to 2007.
- Severe Tropical Cyclone Larry passed over the Innisfail sector in March 2006, but caused limited damage on mid-shelf and outer shelf reefs, in part because it moved quickly and also because coral cover was already low after extensive COTS outbreaks in the late 1990s.
- The trends in occurrence of coral diseases have been uneven. The occurrence of white syndrome declined in most subregions after a peak in 2003, but then returned to intermediate levels in 2006 and 2007. This occurred particularly in the Cooktown-Lizard Island sector and on outer shelf reefs in the Cairns, Townsville and Capricorn-Bunker sectors.
Reef fishes
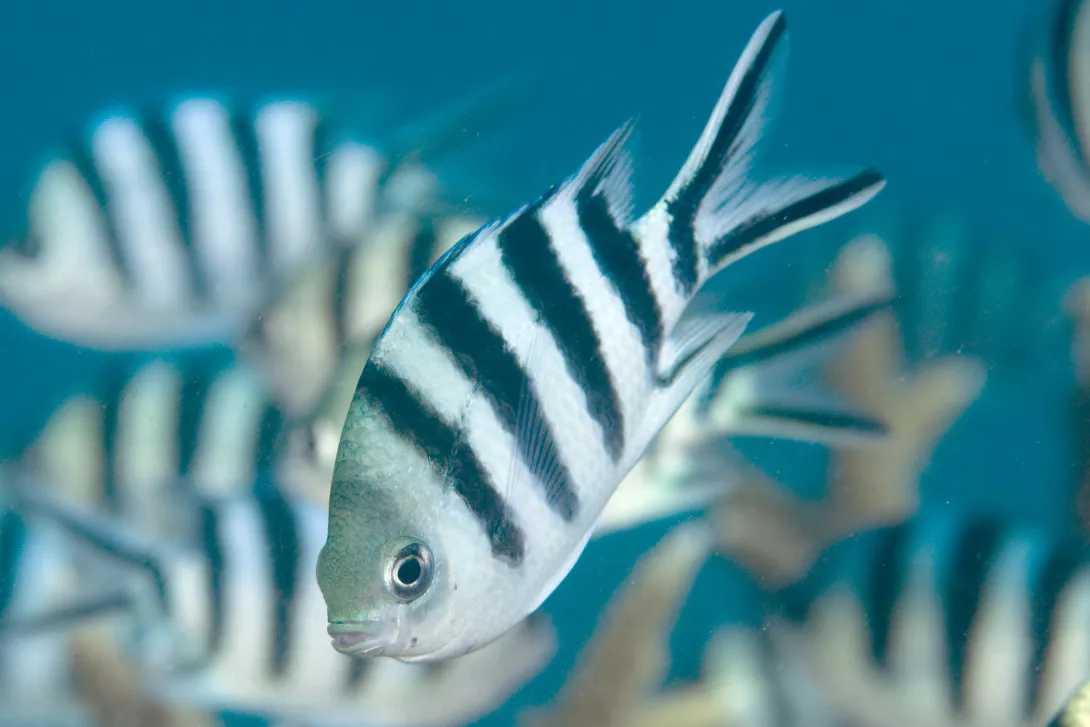
Description
Damsel fish on Great Barrier Reef
While abundance of many groups of fishes showed significant long term and current trends in various regions, there were only a few instances where a majority of groups in a region showed a consistent trend, these are usually related to changes in coral cover:
- The majority of larger, more mobile fish families, and damselfish genera, increased in abundance over the 13 years of surveys in the Capricorn-Bunker sector. Several groups, such as surgeonfishes, butterflyfishes, parrotfishes, wrasses and coral associated damselfishes continued to increase in 2006 and 2007. Coral cover increased greatly in this region from very low levels recorded in 1989; the changes in fish assemblages reflect this.
- In other sectors, most families of larger mobile fishes showed little net change in abundance over the 15 years of surveys. Most families also did not change in abundance over the last two surveys.
- In other sectors, changes in abundance of most damselfish genera were not consistent within regions over the 13 years of surveys. Based on the last two surveys, more damselfish genera increased than decreased, particularly in the Cooktown-Lizard Island and Whitsunday sectors.
Effects of rezoning the Great Barrier Reef Marine Park in 2004
At the time of this report the RAP reefs had been surveyed once in 2006, 18-24 months after the new zoning took effect. Surveys found that the numbers of coral trout, the primary target species of commercial fishers, were higher on no-take reefs than on reefs that were open to fishing in all five regions by an average of 54%. Finding higher numbers of coral trout in the no-take reefs so soon after the rezoning is encouraging and is presumably due to reduced fishing mortality on the no-take reefs. Most fishing pressure on these mid-shelf and outer shelf reefs is commercial rather than recreational and there was a large reduction in commercial fishing effort following a restructure of the line fishing industry and the introduction of a quota system in 2004. This makes it likely that fishing pressure did not increase substantially in the reduced area that remained open to fishing.
Attachments
- Documentgbraimsltmp-status-report-no8-2008.pdf (12.92 MB)
Related content