Description
Locations that are presently at less than (green) or exceed (orange and red) the water quality guideline value of a minimum annual mean of 10 m Secchi depth. Orange zones show areas that exceed the guideline values, having Secchi depths of 5–10 m. Red zones show areas of greatest concern with Secchi depth <5 m. The level of fading (right panel) indicates the level of confidence in the estimates with faded areas being more uncertain.
The study reported here defines water quality guideline values for the Great Barrier Reef (GBR). The analyses showed that algal cover and the richness of hard corals and octocorals were strongly related to chlorophyll and water clarity. The richness of both hard corals and phototrophic octocorals decreased with increasing turbidity and chlorophyll. Heterotrophic octocorals increased with greater turbidity and slightly decreased with higher chlorophyll. Guideline values of maximum mean annual concentrations of chlorophyll of 0.45 g/L and minimum mean annual Secchi depth of 10 m are proposed for both coastal and inshore zones in all regions (at shallower depths the sea floor will be visible).
Chlorophyll guidelines need to be seasonally adjusted to values 40% higher in summer, i.e. 0.63 μg/L, and winter guidelines should be 30% lower, i.e., 0.32 μg/L. Seasonal adjustments for Secchi depths are not suggested since there is insufficient data on temporal variation. The proposed guideline values represent a compromise between the current water quality status and that of a pristine system.
The required changes in coastal and inshore chlorophyll and water clarity were calculated for each of the NRM regions. In inshore waters, water clarity is close to the guideline value in all regions, while chlorophyll would need to be reduced by 46% and 8% on inshore reefs of the Burnett-Mary and the Burdekin regions, respectively, to substantially improve reef biodiversity. In coastal waters, reductions in mean annual chlorophyll by 22 to 63%, and increases in water clarity by 56 to 170% will be necessary to re-establish highly diverse coral communities and reduced macroalgal cover.
In coastal reefs of all regions other than Cape York, macroalgal cover would be reduced to about half of current values if water clarity and chlorophyll were improved simultaneously. Hard coral richness on coastal reefs in the Burnett-Mary, Fitzroy and Wet Tropics would increase by 44–47% compared to present-day values, and in the Mackay-Whitsundays and Burdekin by ~30%. On inshore reefs, hard coral richness would increase by 20–25% in the Fitzroy and Mackay regions. The richness of phototrophic octocorals would increase on coastal reefs by 63–84% compared to present-day values, and on inshore reefs, the increase would be 44–51% in the Fitzroy and Mackay-Whitsundays regions. Finally, the simultaneous improvement of chlorophyll and water clarity would lead to only minor changes in the richness of heterotrophic octocorals on coastal and inshore reefs.
The analyses show that levels of chlorophyll and water clarity are strong indicators of ecosystem health of the GBR and should be considered for use in any monitoring program of reef health. They are also cost-effective since they can be recorded through automated turbidity and chlorophyll loggers at fixed stations. The design of such a monitoring program requires additional consideration of sampling intensity, seasonal variation and site locations prior to implementation.
Details of this study can be found in: De’ath G and Fabricius KE (2007). Water quality of the Great Barrier Reef: distributions, effects on reef biota and guideline values for conservation of ecosystem health. Final Report to the Great Barrier Reef Marine Park Authority. Australian Institute of Marine Science, Townsville.
The study was funded by the Australian Institute of Marine Science, the Great Barrier Reef Marine Park Authority and the Marine and Tropical Sciences Research Facility (MTSRF), a part of the Australian Government’s Commonwealth Environment Research Facilities Programme.
Background
The identification of guideline values for light, nutrients and sediments for the inshore GBR is an essential component of the Great Barrier Reef Marine Park Authority’s water quality guidelines (Honchin et al. 2007). Models of river nutrient discharges and proxies of sedimentation recorded in coral skeletons suggest about five-fold higher mean annual sediment discharges within the last 140 years than before European settlement (McCulloch et al. 2003). As rivers are considered the largest source of new nutrients and sediments injected into the inshore waters of the GBR (Furnas 2003), future changes in water quality conditions in the GBR are to some extent dependent on the nature and intensity of land use. This recognition has led to the creation of the Reef Water Quality Protection Plan (the Reef Plan), the aim of which is to halt and reverse the amount of nutrients and sediments entering the GBR lagoon through the adoption of best land management practices.
Existing water quality targets for turbidity, nutrients and sediments were set without explicit knowledge of the ecosystem effects that would be derived from compliance. To guide management in the implementation of the Reef Plan, catchment-specific guideline values, objectives and eventually targets of acceptable levels of pollutants need to be defined that specifically apply to rivers and coastal and inshore waters along the whole length of the GBR (Honchin et al. 2007).
The following four measures were chosen as indicators of ecosystem condition:
- the taxonomic richness of hard corals;
- macroalgal cover;
- the taxonomic richness of phototrophic octocorals, and
- the taxonomic richness of heterotrophic octocorals.
Little experimental information is available about causal relationships between long-term exposure (months to years) and ecosystem health. The Queensland Environmental Protection Agency (2006) recommends guideline values of the 50th percentile (median) of values at reference sites in areas of ‘high ecological value’, such as the GBR, and the 80th and/or 20th percentile elsewhere. However, we argue that short periods of high nutrient concentrations are ecologically significant, and such values are not reflected in median values. In contrast to medians, mean annual values at least partially capture and reflect both the frequency and magnitude of ‘water quality events’ (e.g. floods and other events that result in high values), and annual average values are therefore proposed to be used as the preferred measure for guideline values, as also recommended by the European Water Framework Directive (European Community 2005).
Chlorophyll and some nutrient levels vary seasonally, with higher nutrient inputs, temperatures and light in summer than in winter (Furnas 2003). Long-term averages of chlorophyll are about 70% higher in March than in September in the GBR (Fig. 1; De'ath 2007b). Although guideline values should ideally include additional separate values for flood conditions, this appears impractical due to the unpredictable timing and varying intensity of monsoonal floods. Seasonally adjusted long-term averages rather than flood values are therefore the most practical solution to define guideline values for the time being.
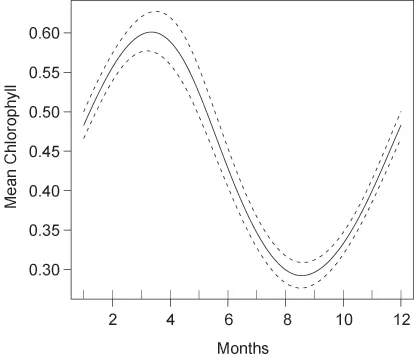
Figure 1: Estimated seasonal variation of chlorophyll concentrations in the GBR, averaged over all locations.
Responses of biota to changes in Secchi and chlorophyll
The spatial distribution of water quality variables across the six NRM regions, split by the three cross-shelf positions into coastal, inshore and offshore values are presented in the section on water quality. The spatial distributions of reef biota across the NRM regions and the three cross-shelf zones are presented in the section on reef biota.
a) Macroalgal cover
Macroalgal cover increased steeply with declining water clarity at Secchi values <13 m, and increased weakly with chlorophyll (Fig. 2). Macroalgal cover increased from 6 to 21% as water clarity declined from 13 to 4 m, and additionally by 33% (from 9.5 to 12.5%) as chlorophyll increased from 0.3 to 0.8 μg/L. Additionally, macroalgal cover declined four-fold across the shelf and four-fold along the shelf.
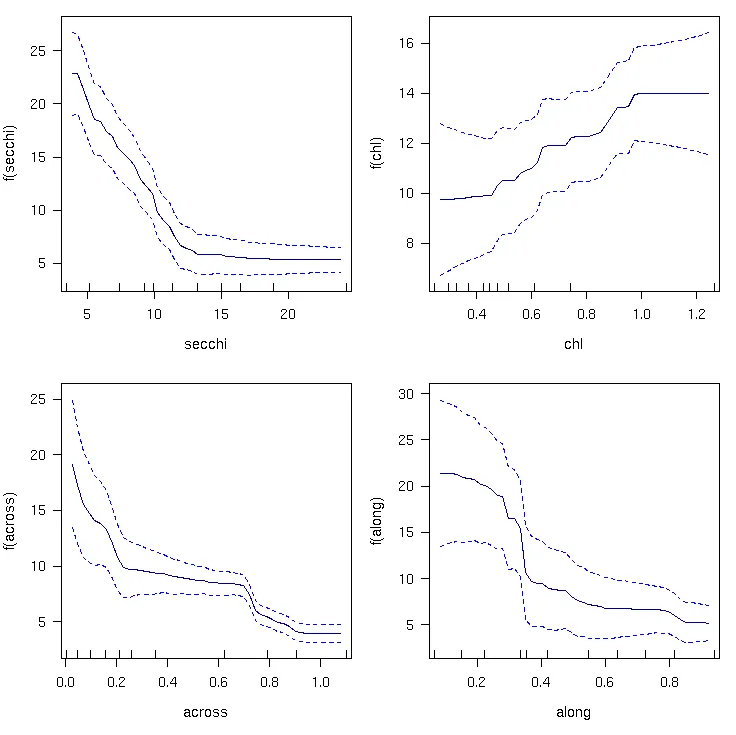
Figure 2: Partial effects plots of changes of macroalgal cover along gradients of water clarity, chlorophyll, and distance across and along the shelf.
b) Hard coral species richness
The species richness of hard corals increased with increasing water clarity from 87 to 108 taxa; Fig. 3). Additionally, richness increased with decreasing chlorophyll by 14% (from 88 to 100 taxa). The greatest changes occurred when Secchi depth was in the range 8–13 m and chlorophyll was 0.25–0.4 μg L-1. Richness was unrelated to water clarity and chlorophyll in clearer water. Hard coral richness declined by ~16% towards the coast and fluctuated between 60 and 20 taxa per reef along the GBR.
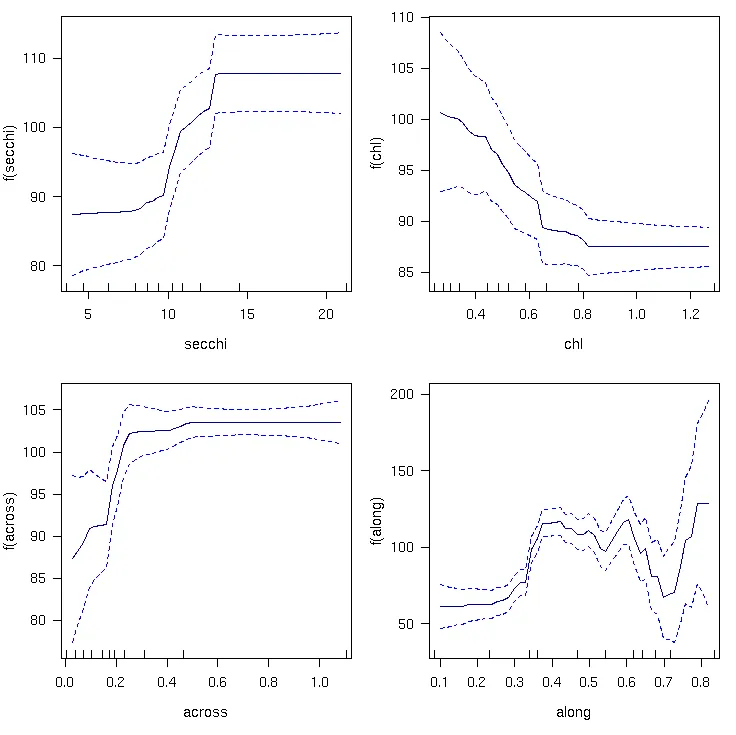
Figure 3: Partial effects plots of changes of the species richness of hard corals along gradients of water clarity, chlorophyll, and distance across and along the shelf.
c) Richness of phototrophic octocorals
The taxonomic richness of phototrophic octocorals increased by ~30% as water clarity increased from 5 to 15 m, and steeply declined by ~40% as chlorophyll increased from 0.25 to 0.5 g/L (Fig. 4). Richness was unaffected by water quality at Secchi depth >15 m and chlorophyll levels below 0.35. Richness declined steeply towards the inshore (<0.4 across) and increased to the north.
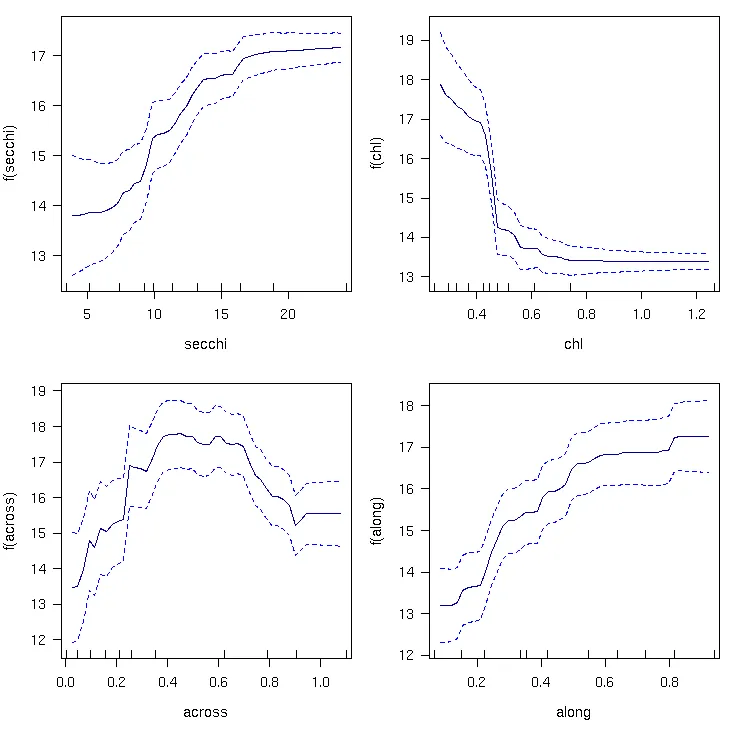
Figure 4: Partial effects plots of changes in the species richness of phototrophic octocorals along gradients of water clarity, chlorophyll and distance across and along the shelf.
d) Richness of heterotrophic octocorals
The taxonomic richness of heterotrophic octocorals decreased by ~25% with increasing water clarity and declined by ~20% with increasing chlorophyll (Fig. 5). Heterotrophic richness increased towards the coast and towards the north.
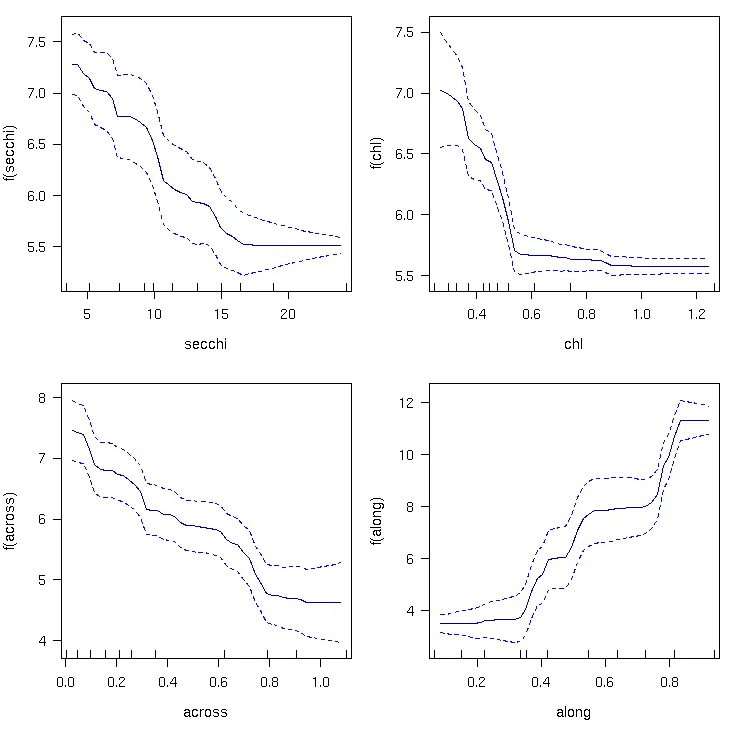
Figure 5: Partial effects plots of changes in the species richness of heterotrophic octocorals along gradients of water clarity, chlorophyll, and distance across and along the shelf.
Suggested guideline values for Secchi and chlorophyll
The highest chlorophyll and Secchi values that prevented high macroalgal cover and major reductions in coral and octocoral richness were in the range of 0.4–0.5 μg/L mean annual chlorophyll concentration and 10–15 m Secchi depth (Fig. 6). These values were similar to the ones found in Cape York inshore waters, a region that is assumed to have relatively unaltered water quality conditions. This suggests that a significant reduction in ecosystem health can be prevented if mean annual water clarity does not drop below 10 m Secchi depth (at shallower depths Secchi will be visible on the seafloor), and mean annual chlorophyll concentration remains below 0.45 μg/L. These values are proposed as guideline values for water quality improvement. Further reductions in chlorophyll and increases in water clarity would provide additional significant improvement of ecosystem health. These guideline values benefit photosynthetic organisms such as corals and phototrophic octocorals, and do not adversely affect other important reef organisms such as heterotrophic octocorals. Chlorophyll values are ~40% higher in summer and ~30% lower in winter than mean annual values so seasonal chlorophyll guidelines should be adjusted accordingly (to 0.63 μg/L in summer and 0.32 μg/L in winter). Seasonal adjustments for Secchi depths are not possible due to lack of seasonal data.
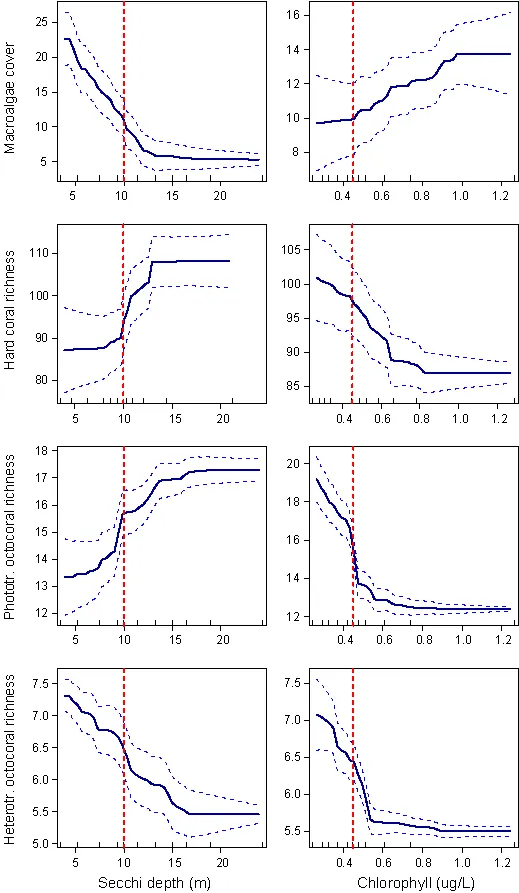
Fig. 6: Responses of all biota along gradients of increasing chlorophyll and water clarity.
Suggested guideline values for SS, PN and PP
Due to the high correlation between particulate nitrogen (PN), particulate phosphorus (PP), suspended solids (SS) and Secchi, it is not possible to resolve their individual effects on ecosystem health, and inclusion of all variables simultaneously leads to spurious conclusions about such effects. To obtain approximate guideline values, the responses of biota to each of the water quality variables SS, PN and PP were analysed separately. Macroalgal cover increased about four-fold with SS increasing from 1.2 to 2.0 mg/L and remained high above this level. Macroalgal cover also increased by >50% with increasing PN and by ~40% with increasing PP. Hard coral richness steeply declined with SS, with highest values at <0.8 mg/L SS and low richness at >2.0 mg/L. It also declined with PN and PP, with highest values at <1.0 µmol/L PN and <0.06 µmol/L PP and low richness at >1.8 µmol/L PN and >0.10 µmol/L PP. The declines in phototrophic octocoral richness were much steeper than those of the hard corals. Richness was highest at <1 mg/L SS, 1.0 µmol/L PN and 0.05 µmol/L PP. Richness was up to 50% lower when SS exceeded 2.0 mg/L SS, 1.6 µmol/L PN and 0.10 µmol/L PP. Heterotrophic richness did not respond much to SS and PN, and only weakly declined with PP increasing above 0.08 µmol/L. Based on the biotic responses and the concentrations found in Cape York, the following maximum annual means were proposed as guideline values: 1.5 mg/L SS, 1.5 µmol/L (= 20 µg/L) PN and 0.09 µmol/L (2.8 µg/L) PP. Setting lower nutrient concentrations as guidelines would lead to further reduction in macroalgal cover and substantial increases coral biodiversity. For SS, the response curves suggested that guideline values should be lower than the concentrations found in the coastal zone of Cape York to prevent extensive macroalgal cover and loss of biodiversity. Seasonal adjustments for SS, PN and PP are about 20% of mean annual values.
Effects of improved water quality on reef biodiversity
Water quality changes required to achieve guideline values
The changes in chlorophyll and water clarity necessary to achieve the proposed guideline values are listed in Table 1. In coastal waters, reductions in chlorophyll of 22–63% and increases in water clarity of 56–170% will be necessary to re-establish highly diverse coral communities and reduced abundances of macroalgae. Within individual NRM regions and zones, some areas of coastline already meet or are close to meeting the targets, while other areas should be considered priority areas for management intervention (Figs. 7 and 8). Most noticeably, coastal nutrient concentrations greatly exceed the targets in the areas north of the Burnett, Burdekin, Fitzroy, Herbert, Tully and Johnstone rivers, likely due to influences of river discharges. Water clarity in the Broad Sound is partly determined by the high tidal ranges leading to intense resuspension regimes. Nutrient levels in this zone are low, suggesting a low terrestrial contribution to this turbidity. It appears advisable to relax the guideline values by 20% for areas with a tidal range >5 m.
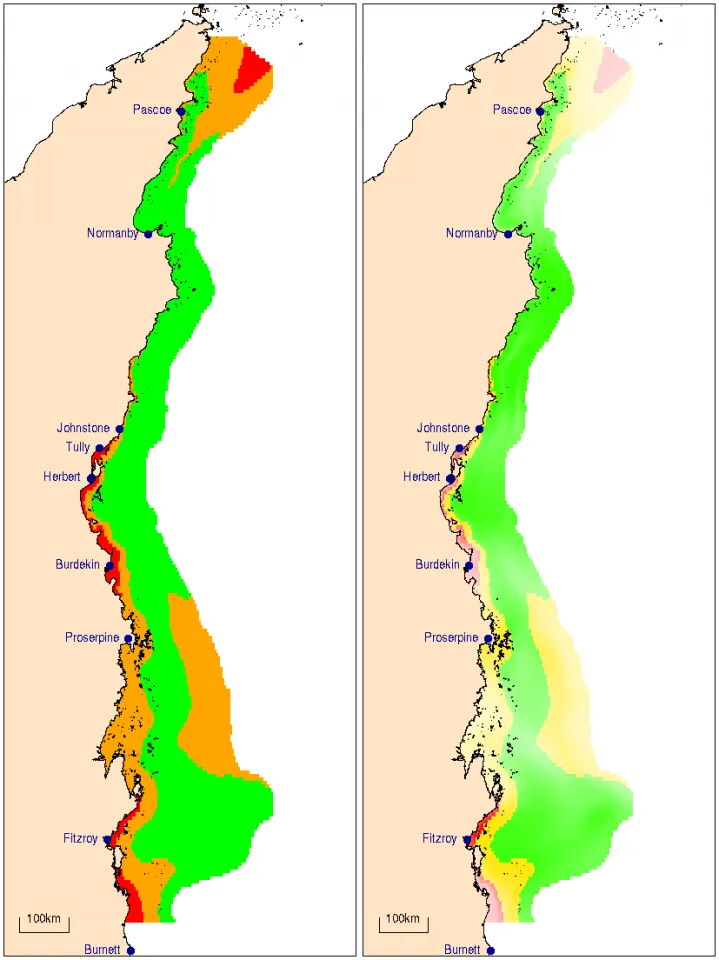
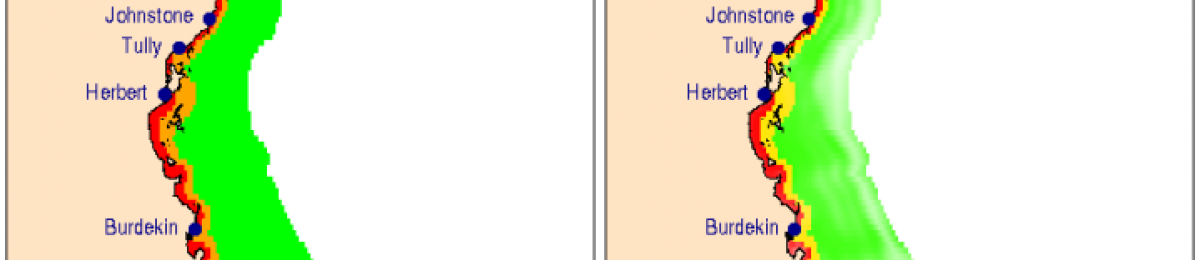
Figure 7: Locations that are presently at less than (green) or exceed (orange and red) the water quality guideline value of a maximum annual mean of 0.45 μg L-1 chlorophyll. Orange zones show areas that exceed the guideline values, with chlorophyll values of 0.45–0.8 μg L-1. Red zones show areas of greatest concern with >0.8 μg L-1 chlorophyll. The level of fading (right panel) indicates the level of confidence in the estimates with faded areas being more uncertain.
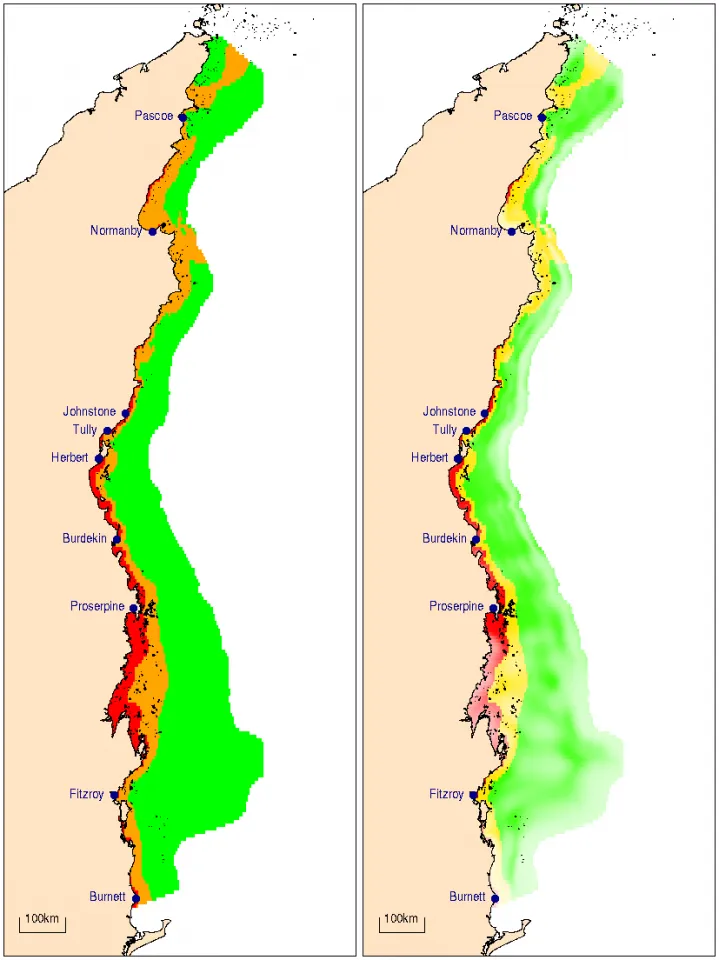
Figure 8: Locations that are presently at less than (green) or exceed (orange and red) the water quality guideline value of a minimum annual mean of 10 m Secchi depth. Orange zones show areas that exceed the guideline values, having Secchi depths of 5–10 m. Red zones show areas of greatest concern with Secchi depth <5 m. The level of fading (right panel) indicates the level of confidence in the estimates with faded areas being more uncertain.
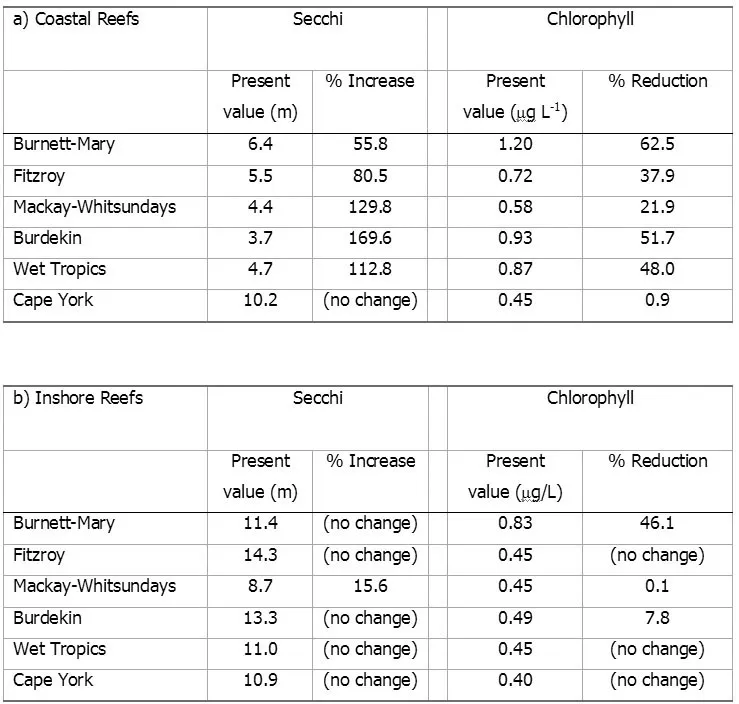
Table 1: Percentage changes required for each region to achieve a mean annual water clarity target of 10 m Secchi depth and a mean annual chlorophyll level of 0.45 μg/L.
Predicted changes in reef health after implementation of guidelines
A number of changes would occur on coastal and inshore reefs if mean If mean Secchi depth is >10 m, and mean chlorophyll levels are <0.45 μg/L. As indicated above, Secchi depth is highly correlated with SS, PN and PP and so can be used as a proxy for these three water quality variables. The analyses show that:
a) Macroalgal cover: In coastal reefs of all regions other than Cape York, macroalgal cover would approximately halve if water clarity and chlorophyll were to be simultaneously improved.
b) Hard coral richness: The simultaneous improvement of water clarity and chlorophyll would have greatest benefits in the southern regions. Coral richness on coastal reefs in the Burnett-Mary, Fitzroy and Wet Tropics would increase by 44–47% compared to present-day values, and in the Mackay-Whitsundays and Burdekin by ~30%.
c) Richness of phototrophic octocorals: The simultaneous improvement of water clarity and chlorophyll concentrations would increase the richness of phototrophic octocorals on coastal reefs in all regions except Cape York by 63–84% compared to present-day values. On inshore reefs, the benefits would still be substantial (44–51% in the Fitzroy and Mackay-Whitsundays region). Changes in chlorophyll will have a far greater effect on coral richness than changes in water clarity.
d) Richness of heterotrophic octocorals: A reduction in chlorophyll would lead to gains in the richness of heterotrophic octocorals, while increased water clarity would lead to slight losses of heterotrophic taxa. The simultaneous improvement of chlorophyll and water clarity would lead to 13–34% gains in the southern three regions (greater gains inshore than on coastal reefs), and small changes (ranging from 6% gains to 9% losses) on coastal and inshore reefs of the three northern regions.
Discussion
We have shown that a number of biotic measures (indicators) are well predicted by chlorophyll and water clarity in the GBR, and we have used these relationships to predict how ecosystem health is related to changing water quality (other factors remaining unchanged). Other forms of disturbance (such as storms, bleaching etc) would affect this relationship and more complex ecological models would be required to factor in such responses and interactions into the analyses. The relationship between light, suspended solids and turbidity (water clarity) depends on the nature of the particulate matter (Te 1997), and this relationship is not yet fully understood for the GBR. In order to implement policies that will lead to improvements in water quality and hence ecosystem health, effective monitoring of water quality of the GBR is required. The two measures proposed here – Secchi and chlorophyll – have distinct advantages over other possible measures as predictors for our measures of ecosystem health. An effective monitoring program could be implemented cost-effectively on a relatively short term basis, with the main effort focusing on the coastal and inshore zone. Biological monitoring programs are needed to measure the effects of pollutants on the reef system. Indicators that are relatively specific to water quality changes, such as macroalgal abundances, hard coral and octocoral richness, coral recruitment and recruit survivorship, macrobioeroder densities in living massive Porites, the photosynthetic performance of corals, and nature of biofilms on natural substrata should be used in such a program (Fabricius et al. 2007).
References
- Brodie J, De'ath G, Devlin M, Furnas M, Wright M (2007) Spatial and temporal patterns of near-surface chlorophyll a in the Great Barrier Reef lagoon. Marine and Freshwater Research 58:343-352.
- De'ath G (2007a) Boosted trees for ecological modeling and prediction. Ecology 88:243-251.
- De'ath G (2007b) The spatial, temporal and structural composition of water quality of the Great Barrier Reef and indicators of water quality. Australian Institute of Marine Science, Townsville 59.
- DeVantier L, De'ath G, Done T, Turak E, Fabricius K (2006) Species richness and community structure of reef-building corals on the nearshore Great Barrier Reef. Coral Reefs 25:329-340.
- Environmental_Protection_Agency (2006) Queensland Water Quality Guidelines. The State of Queensland Environmental Protection Agency 121.
- European_Community (2005) Water Framework Directive (WFD). Proposal for a Directive of the European Parliament and of the Council establishing a Framework for Community Action in the field of Marine Environmental Policy (Marine Strategy Directive) [SEC(2005) 1290], Brussels, 24.10.2005.
- Fabricius K, De'ath G (2001a) Environmental factors associated with the spatial distribution of crustose coralline algae on the Great Barrier Reef. Coral Reefs 19:303-309.
- Fabricius K, Uthicke S, Cooper T, Humphrey C, De'ath G, Mellors J (2007) Candidate bioindicator measures to monitor exposure to changing water quality on the Great Barrier Reef. Interim Report. . Catchment to Reef Research Program - CRC Reef and Rainforest CRC and Australian Institute of Marine Science, Townsville 225.
- Fabricius KE, De'ath G (2001b) Biodiversity on the Great Barrier Reef: Large-scale patterns and turbidity-related local loss of soft coral taxa. In: Wolanski E (ed) Oceanographic processes of coral reefs: physical and biological links in the Great Barrier Reef. CRC Press, London, pp 127-144.
- Furnas MJ (2003) Catchments and Corals: Terrestrial Runoff to the Great Barrier Reef. Australian Institute of Marine Science, CRC Reef. Townsville, Australia.
- Honchin C, Gray L, Brodie J, Haynes D, Moss A (2007) Interim Marine Water Quality Guidelines for the Great Barrier Reef Marine Park. Great Barrier Reef Marine Park Authority, Townsville.
- McCulloch M, Fallon S, Wyndham T, Hendy E, Lough J, Barnes D (2003) Coral record of increased sediment flux to the inner Great Barrier Reef since European settlement. Nature 421:727-730.
- R_Development_Core_Team (2007) R: A language and environment for statistical computing. R Foundation for Statistical Computing. ISBN 3-900051-07-0, URL https://www.r-project.org, Vienna, Austria.
- Te FT (1997) Turbidity and its effects on corals: a model using the extinction coefficient (k) of photosynthetic active radiance (PAR) Proceedings of the 8th International Coral Reef Symposium, Panama, pp 1899-1904.
- Wood SN (2003) Thin plate regression splines. Journal of the Royal Statistical Society, B 675:95-114.