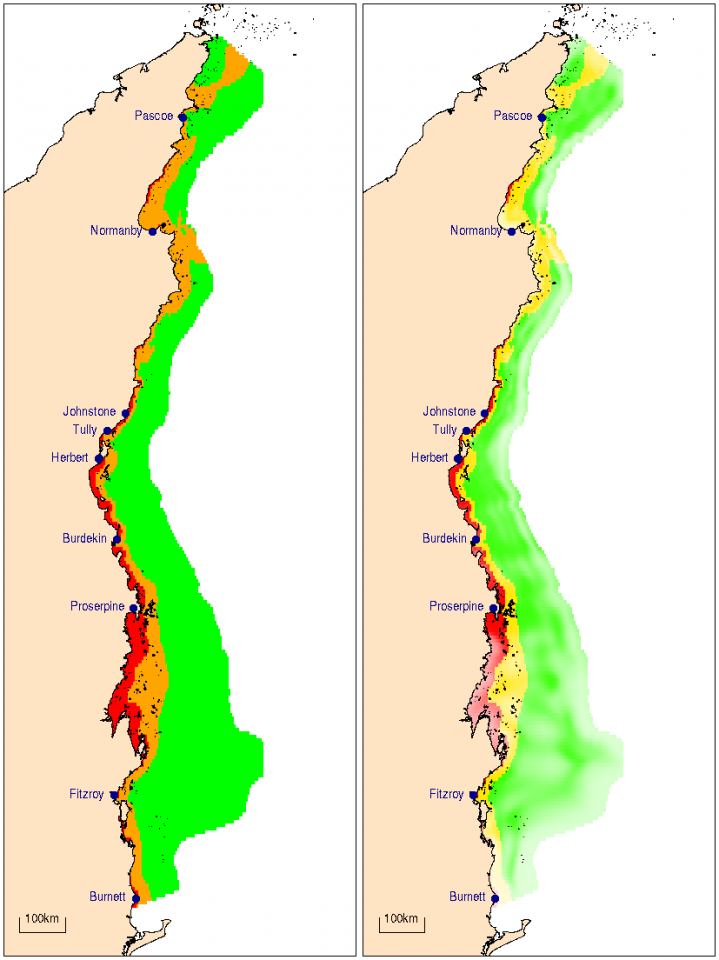
Minimum annual mean of Secchi depth
Image
Licence
©
All rights reserved
Description
Locations that are presently at less than (green) or exceed (orange and red) the water quality guideline value of a minimum annual mean of 10 m Secchi depth. Orange zones show areas that exceed the guideline values, having Secchi depths of 5–10 m. Red zones show areas of greatest concern with Secchi depth <5 m. The level of fading (right panel) indicates the level of confidence in the estimates with faded areas being more uncertain.