 eAtlas Data Catalogue
2009
Type of resources
Topics
Keywords
Contact for the resource
Provided by
Years
Formats
status
-
The aim of this component of the study was to determine how photosynthetic rates related to growth rates both into terms of skeletal deposition and organic carbon accrual associated with linear extension, and with organic carbon accrual associated with fat deposition or lipid enrichment of existent tissue. The study was based on the coral Acropora millepora located at Lizard Island (-14°40’, 145°27’) and at Heron Island (-23°26', 151°54') in the Great Barrier Reef (GBR) of Australia, with data collected for winter and summer months. Coral colonies were monitored for two years, with both summers breaching maximum mean monthly maximum sea surface temperatures, but by less than the NOAA Bleach Watch trigger of 1°C, Lizard Island colonies proved to be highly susceptible to whole colony mortality, with a loss of 2 of 5 colonies monitored. Heron Island colonies proved to be more robust with no whole colony mortality. Interestingly, comparisons of the growth rate of Lizard colonies in summer to that of Heron colonies in winter showed that despite winter heterotrophy in Heron colonies, compared to summer autotrophy in Lizard colonies: Corals had greater linear extension in the winter at Heron, than they did in the summer at Lizard. Heron and Lizard colonies at these times were equally fat with non-significant differences in lipid per surface area. Heron colonies appear to maintain their weight (areal lipid concentrations) and growth (positive linear extension) despite a potential reliance on heterotrophy, whilst Lizard colonies appear to struggle despite high rates of photosynthesis. The study therefore reinforces the notion that projections regarding coral health need to greater appreciate the mixotrophic lifestyle of corals. The following parameters were measured: Temperature in degrees C; Pnet max as micromol O2 h-1 cm-2; Lipid per surface area as mass per cm-2;
-
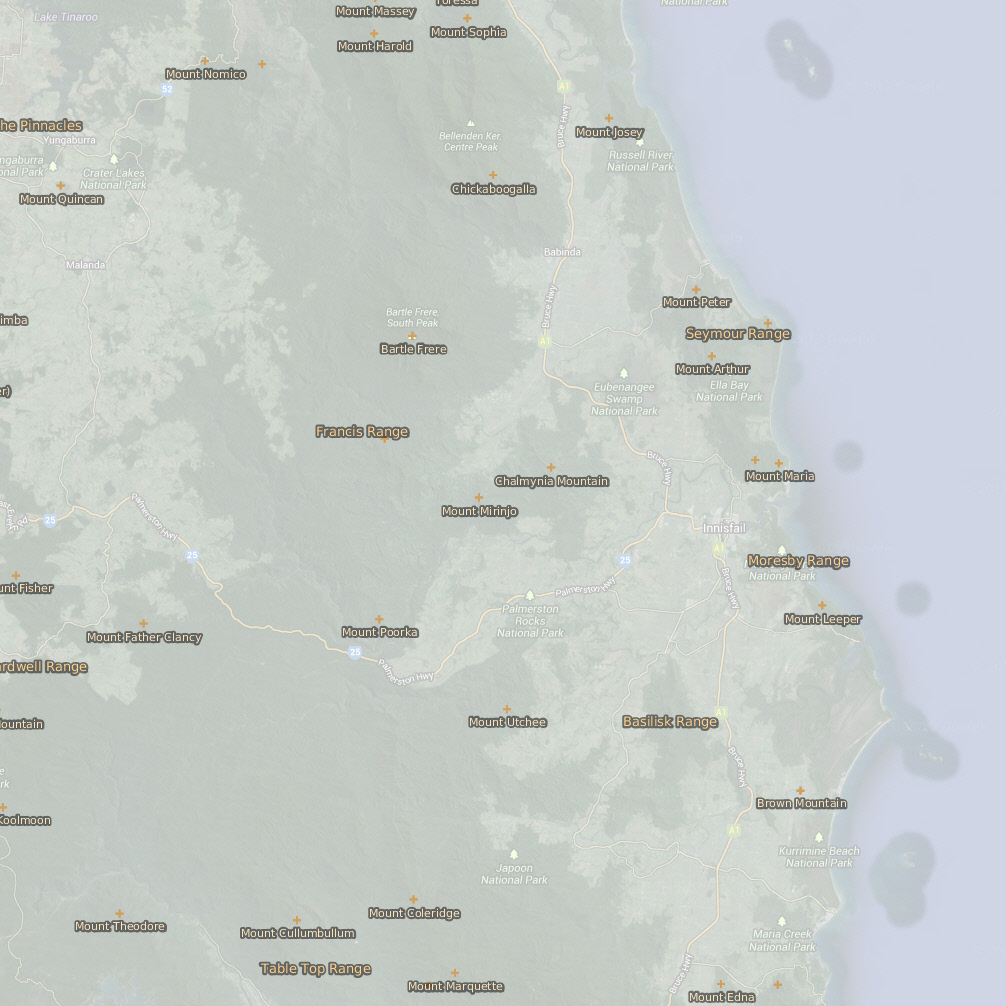
This dataset contains point features depicting mountains, peaks, mountain ranges and hills and their names. Ranges are located with a point or series of points in the approximate vicinity of the feature. Mountain data originated from 1:250,000 scale AUSLIG supplied topographic data (repromats). Corrections were made to locate the points accurately to the 1:100,000 scale National Topographic Map Series. Georeferenced Topographic Maps are dated 1966. This dataset consists of a 90 KB point shapefile containing 344 features. 95% of points within the Mountains coverage were located to the 1:100,000 scale Topographic maps Series. Some smaller hills, mountains and ranges shown on the 1:100,000 scale Topographic map Series, not in the original source data, have not been included in this dataset. 90% of the points are within +/- 50 metres of true position. Data reproduced with permission of Wet Tropics Management Authority This metadata was prepared for the eAtlas and is not authoritative. Please contact the Wet Tropics Management Authority for an authoritative record.