
Figure 5
Image
Licence
©
courtesy
AIMS Reef Monitoring
Description
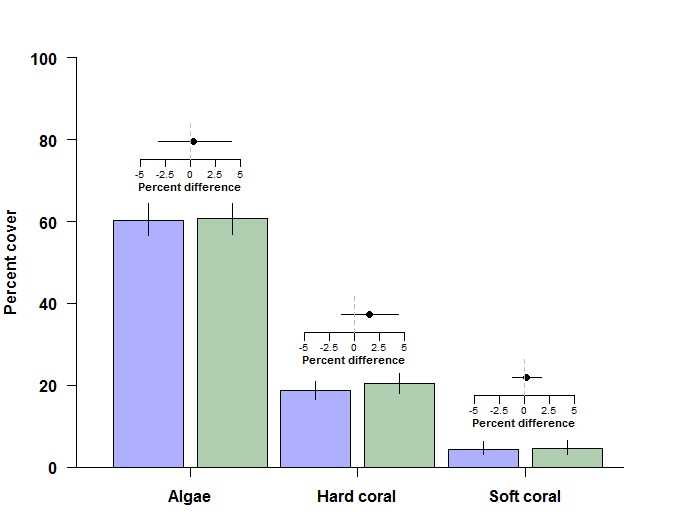
The effect of zoning on algal, soft coral and hard coral cover on the Great Barrier Reef. The bar charts shows the median density and biomass (± 95% uncertainty intervals), while the inset effects (caterpillar) plot shows the median differences (± 95% uncertainty intervals) between No-take Marine Reserves (NTMRs) (green bars) and fished reefs (blue bars). Medians and 95% uncertainty intervals are derived from a Bayesian Hierarchical general linear mixed model and statistical significance is inferred from the effects plot where 95% UIs do not intersect zero.