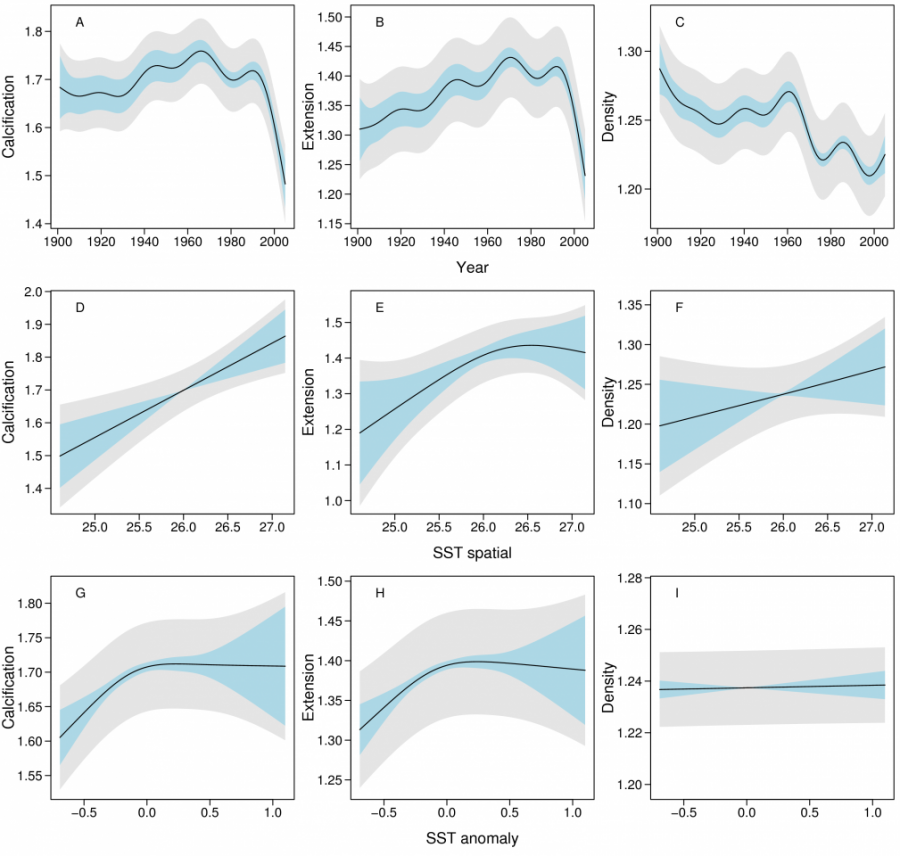
Plots of coral threats over time and with SST

©
Description
Partial effects plots showing the variation of calcification (g cm-2 yr-1), linear extension (cm yr-1) and density (g cm-3) over time and with SST. The effects of SST are partitioned into large-scale spatial (predominantly latitudinal) patterns in SST and SST anomaly that represents annual deviations from the spatial-temporal trends. The models are based on all 328 Porites colonies from 1900 - 2005. Light blue bands indicate 95% confidence intervals for comparison between years or SST, and gray bands indicate 95% confidence intervals for the predicted value at a chosen level of the predictor.


