
Temperature and salinity profiles in the Bremer Bay marine region
Image
Licence

Description
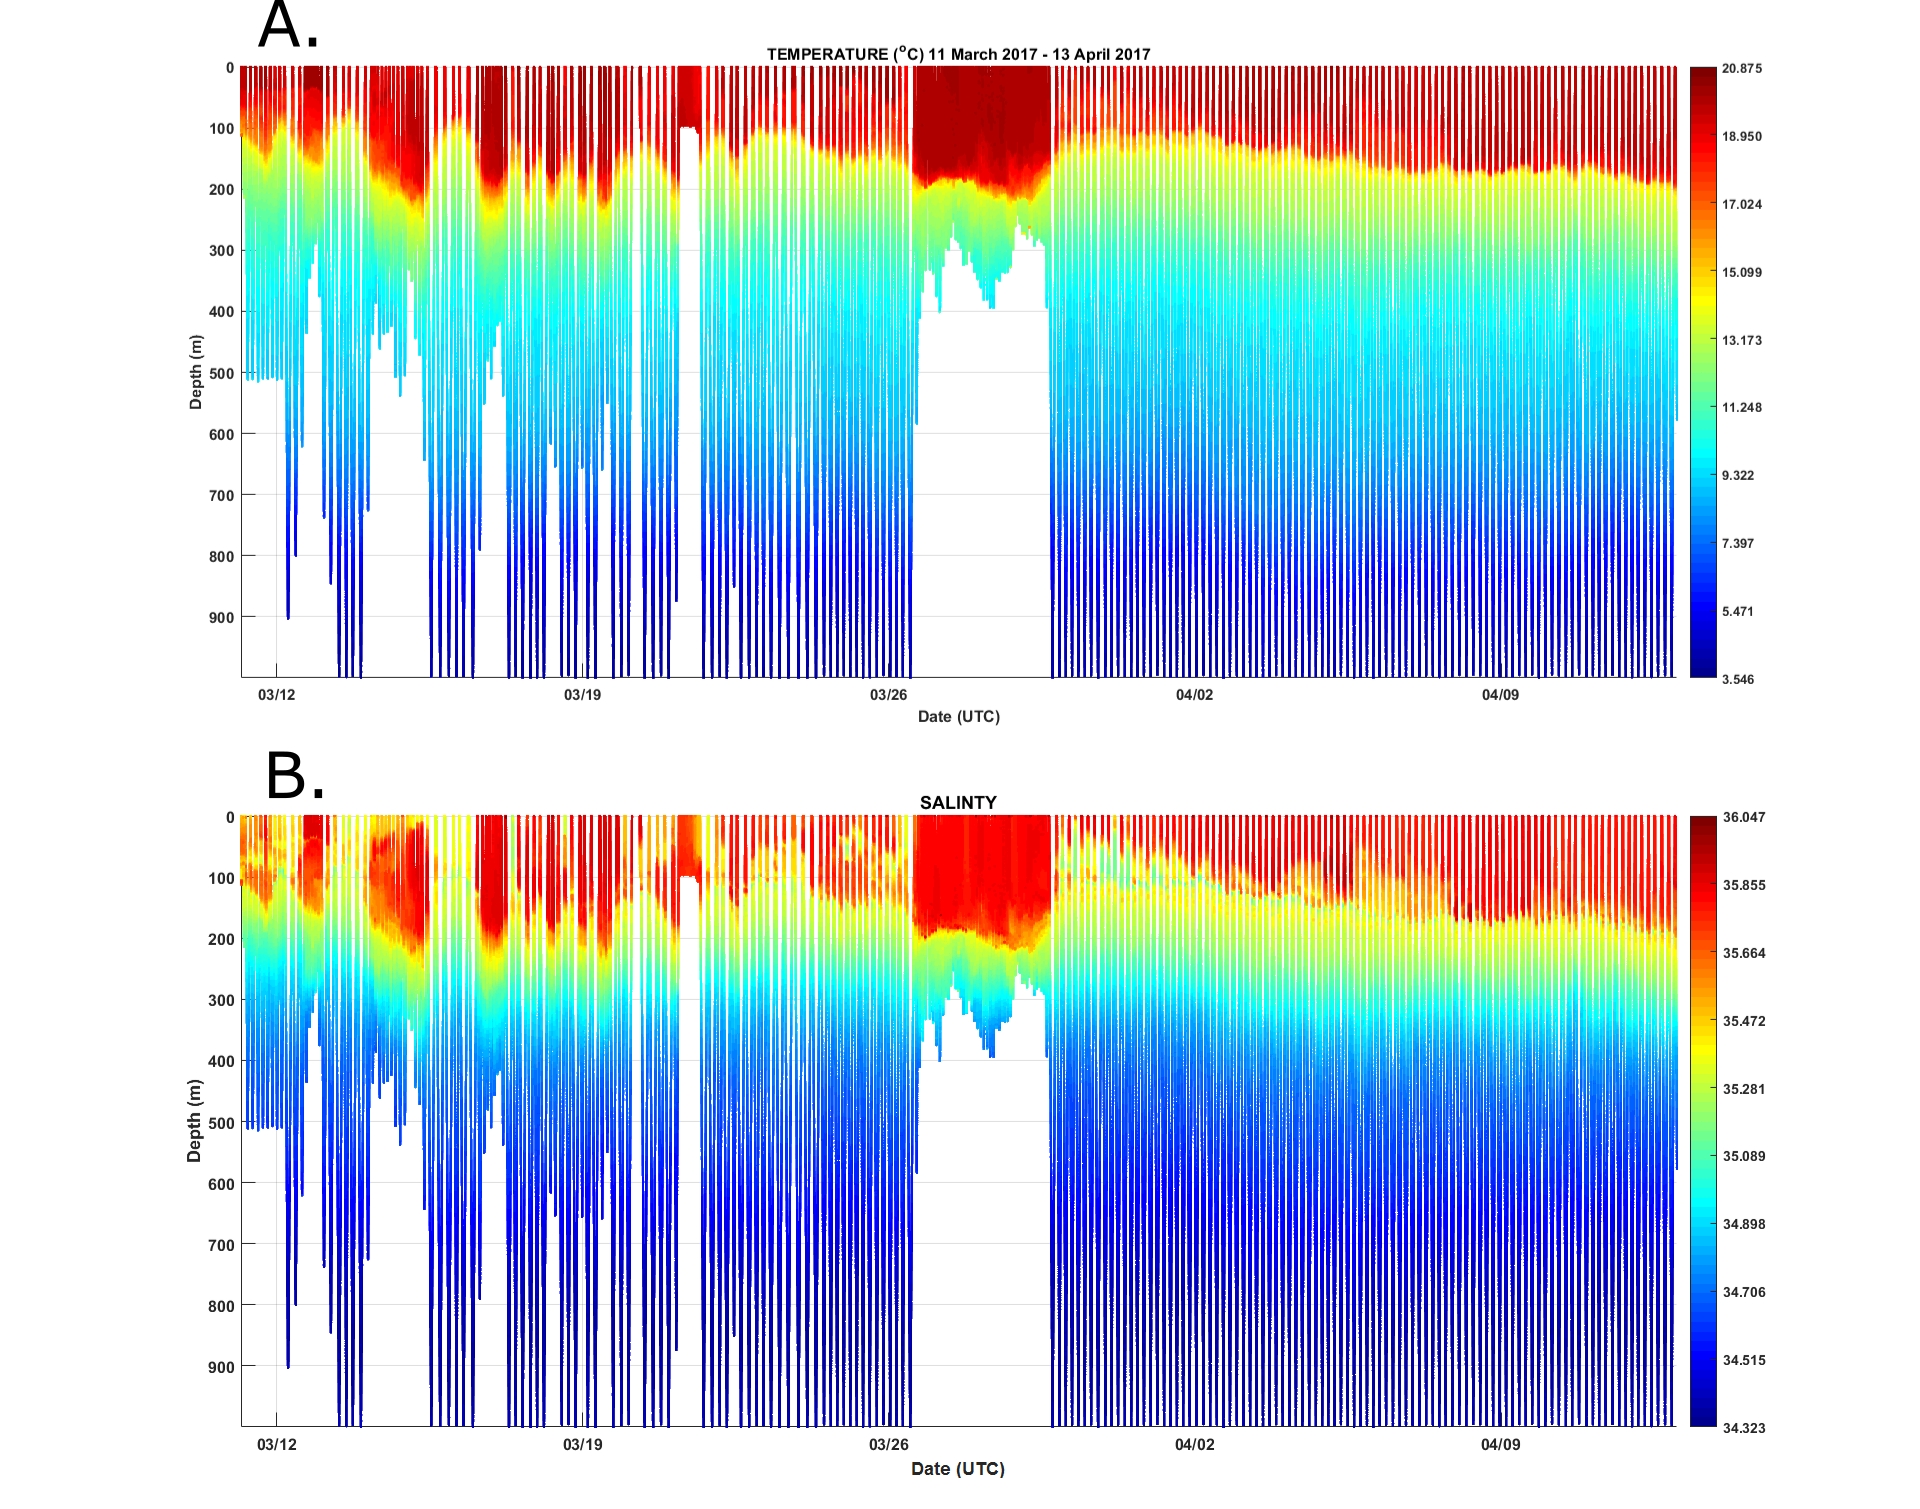
This figure shows (a) seawater temperature and (b) seawater salinity from the surface to 1000 metres depth during the Bremer Bay canyon glider mission. Patterns of seawater temperature and salinity (and therefore density) can reveal a lot about the structure of the ocean currents in a region. This figure shows relatively warm, eastward flowing Leeuwin current water down to about 200 metres depth, which overlays colder water of the Flinders Current and Antarctic Intermediate Water.