

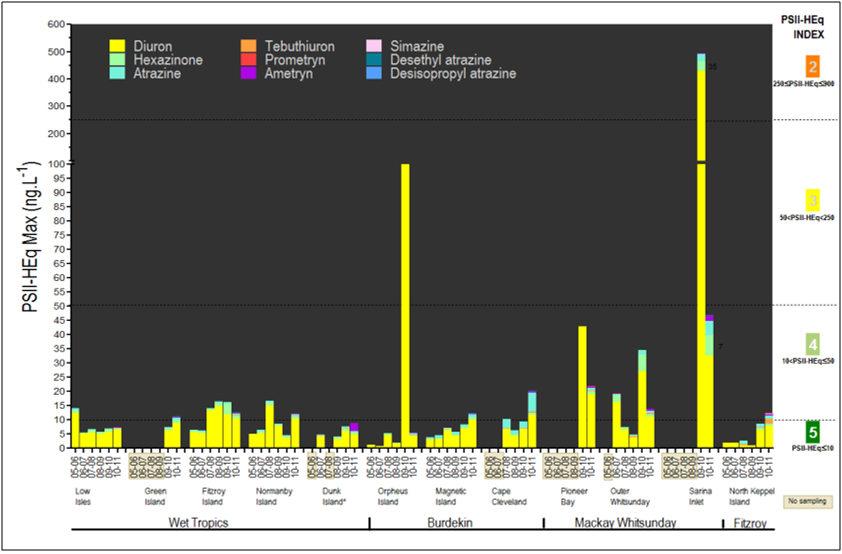
Graph of Maximum Herbicide Equivalent (ng/L) levels including Diuron from along the GBR coast for the Wet Tropics, Burdekin, Mackay, Whitsunday and Fitzroy regions.
Image
Licence
©
All rights reserved
Description
Maximum PSII-Herbicide Equivalent observed from 2005 - 2011 at each sample location. Note the non-linear scale and that the herbicide levels vary considerably over time.