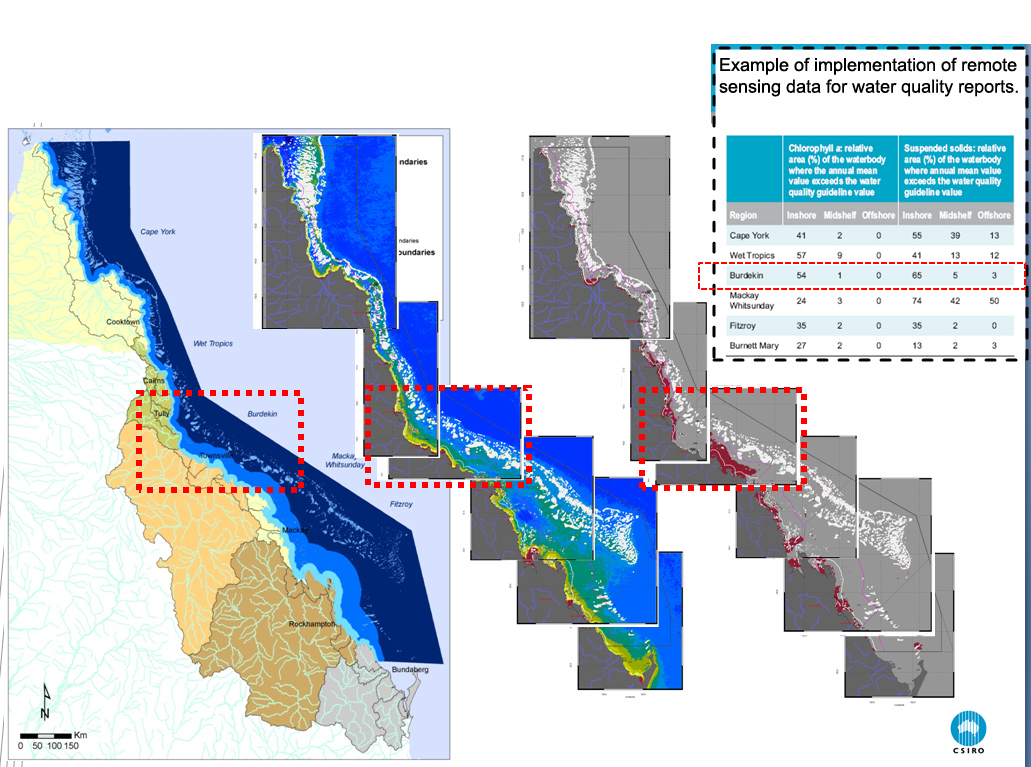
Three maps, first showing water bodies extending out from the queensland coast, second showing chlorophyll levels and third showing areas exceeding the guideline thresholds
Image
Licence
©
All rights reserved
Description
Reference values have been established for each water body (left). Regional maps are created for each variable harvested from the satellite data (middle) and the percent area of the region where the value exceeded the reference value is mapped and reported (right).