Reef Rescue Marine Monitoring Program - Project - Remote Sensing of Water Quality (CSIRO)
This page is archived and only represents the MMP up to 2012. The new main web page for all of the MMP is managed by GBRMPA.
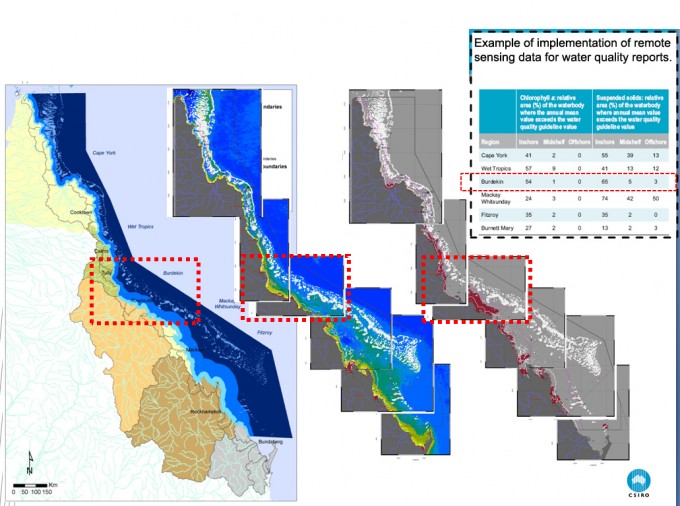
Remote sensing is now recognised as a suitable and cost-effective technique for describing and quantifying aspects of coastal water quality of the Great Barrier Reef (GBR). As a component of Paddock to Reef (link) reporting, water quality estimates retrieved from the MODIS Aqua satellite time series are compared to regionally-specific environmental values and objectives set in 2009 for each of five water bodies identified in the Great Barrier Reef World Heritage Area (GBRWHA).
Remote sensing is now recognised as a suitable and cost-effective technique for describing and quantifying aspects of coastal water quality of the Great Barrier Reef (GBR). As a component of Paddock to Reef reporting, water quality estimates retrieved from the MODIS Aqua satellite time series are compared to regionally-specific environmental values and objectives set in 2009 for each of five water bodies identified in the Great Barrier Reef World Heritage Area (GBRWHA) (Figure 1). For the period May 2010 and April 2011, the percentage area (Table 1) where mean values of chlorophyll (CHL) and total suspended solids (TSS) exceeded the threshold values was higher than the two previous reporting periods, reflecting the large flow conditions in most of the catchments in the GBR and associated freshwater extent. Open Coastal Waters were uniformly high for chlorophyll: greater than 70% of the water body was over the trigger value for each region. There is a coastal to offshore gradient in CHL and TSS concentration, with the inshore waters in the Wet Tropics and Burdekin Regions having elevated concentrations of CHL and TSS over the monitoring period.
Methods
MODIS Aqua satellite provide a time series from November 2002 to present of water quality estimates with spatial coverage at 1 km resolution for the whole-of-GBR lagoon, nominally on a daily basis satellites. Coastal waters are optically complex and global algorithms have been found to be of limited use. Our analysis uses a physics-based approach to characterize the optical properties of GBR coastal waters develop regionally valid algorithm that incorporates regional and seasonal knowledge of optical properties. The regional algorithms perform better than those used for global estimates for all three variables but there is a need for ongoing calibration and validation. The accuracy for the retrieval of chlorophyll (CHL), coloured dissolved organic matter (CDOM) and total suspended solids (TSS) with the coupled physics-based inversion algorithms was 58%, 57% and 66%, respectively.
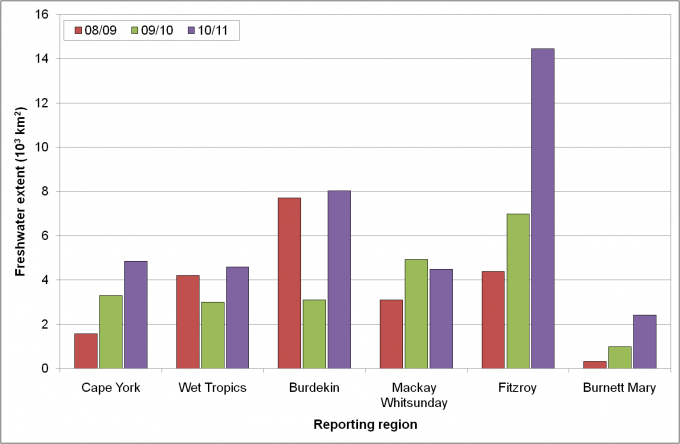
In 2009 regionally-specific environmental values and objectives were set in the GBR catchments for each of five water bodies identified in the Great Barrier Reef World Heritage Area (GBRWHA). (Figure 1). Compliance with the water quality guidelines is based on the analysis of the satellite retrievals of chlorophyll and total suspended solids. The percentage of area that exceeded the mean of the trigger value (EG) is reported for each region and variable (Table 1). Flood plume exposure is mapped from CDOM concentrations as a tracer of terrestrial discharge of low salinity waters. The freshwater extent was estimated from MODIS measurements by applying a threshold to maps of aggregated seasonal maximum CDOM concentrations.
Key results
Flood Plumes
- The extent and inter-annual variability of freshwater plumes in the lagoon were found to be highly positively correlated with river flow data from stream gauges (R2=0.881).
- The freshwater extent for 2010/11 was the largest since 2002/03 for all regions except the Mackay Whitsunday region, reflecting flow conditions two to five times above median levels for most of the catchments in the GBR.
Spatial patterns of CHL and TSS
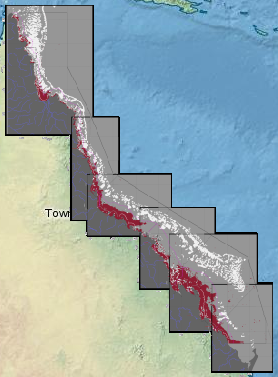
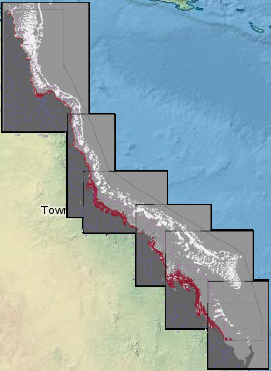
There is a coastal to offshore gradient in CHL and TSS concentration can be observed, with the inshore waters in the Wet Tropics and Burdekin Regions having elevated concentrations of CHL and TSS over the monitoring period.
For the period (1 May 2010 – 30 April 2011)
- The Open Coastal water body shows high areas of chlorophyll (71-97% of relative area of the water body, Table 1). These values were higher than the two previous reporting periods (56-83 % for 2009/10, and 51-84% for 2008/09)
- For all reporting regions the Open Coastal water body shows higher areas of total suspended solids (21-84% of relative area of the water body, Table 1) than in the previous reporting year (12-69 % for 2009/10).
- Large areas of TSS EG also occurred also in Offshore areas, particularly in the Mackay-Whitsunday and Fitzroy reporting regions, consistently with the previous reporting years. These large areas of exceedance of the mean annual TSS values may be due to an over-estimate of the mean TSS concentrations in Offshore waters or to a low guideline threshold value.
|
Chlorophyll-a: Relative area (%) of the water body where the annual mean value exceeds the WQ Guideline value |
Total Suspended Solids: Relative area (%) of the water body where the annual mean value exceeds the WQ Guideline value |
|||||
|---|---|---|---|---|---|---|
|
Open Coastal |
Mid-shelf |
Offshore |
Open Coastal |
Mid-shelf |
Offshore |
|
|
Cape York* |
73 |
13 |
0 |
58 |
57 |
21 |
|
Wet Tropics |
93 |
31 |
2 |
30 |
6 |
30 |
|
Burdekin |
77 |
18 |
0 |
43 |
0 |
19 |
|
Mackay Whitsunday |
71 |
9 |
0 |
84 |
41 |
65 |
|
Fitzroy |
97 |
19 |
0 |
49 |
8 |
47 |
|
Burnett Mary * |
96 |
15 |
0 |
21 |
0 |
4 |
Table 1: Summary of the exceedance of annual mean values of Chlorophyll-a and non-algal particulate matter (as a measure of Total Suspended Solids) for this reporting period (1 May 2010 – 30 April 2011) for the Open Coastal, Mid-shelf and Offshore water bodies. Cells are shaded in gray when more than 50% of the area of the water body exceeds the Guideline value * Caution should be used when interpreting the results for the Cape York and Burnett Mary regions as limited field information was used for the parameterization and validation on the remote sensing retrievals.
Maps
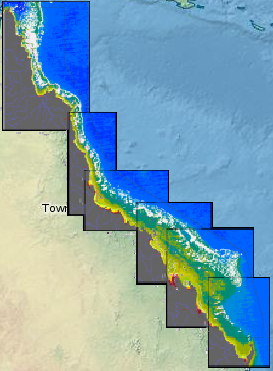
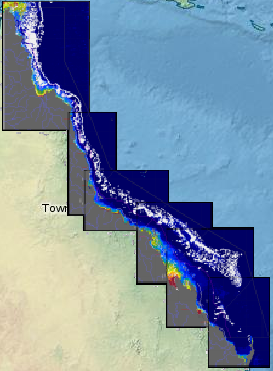
The following map layers are available via the e-Atlas mapping system.
Metadata
To be added.


