

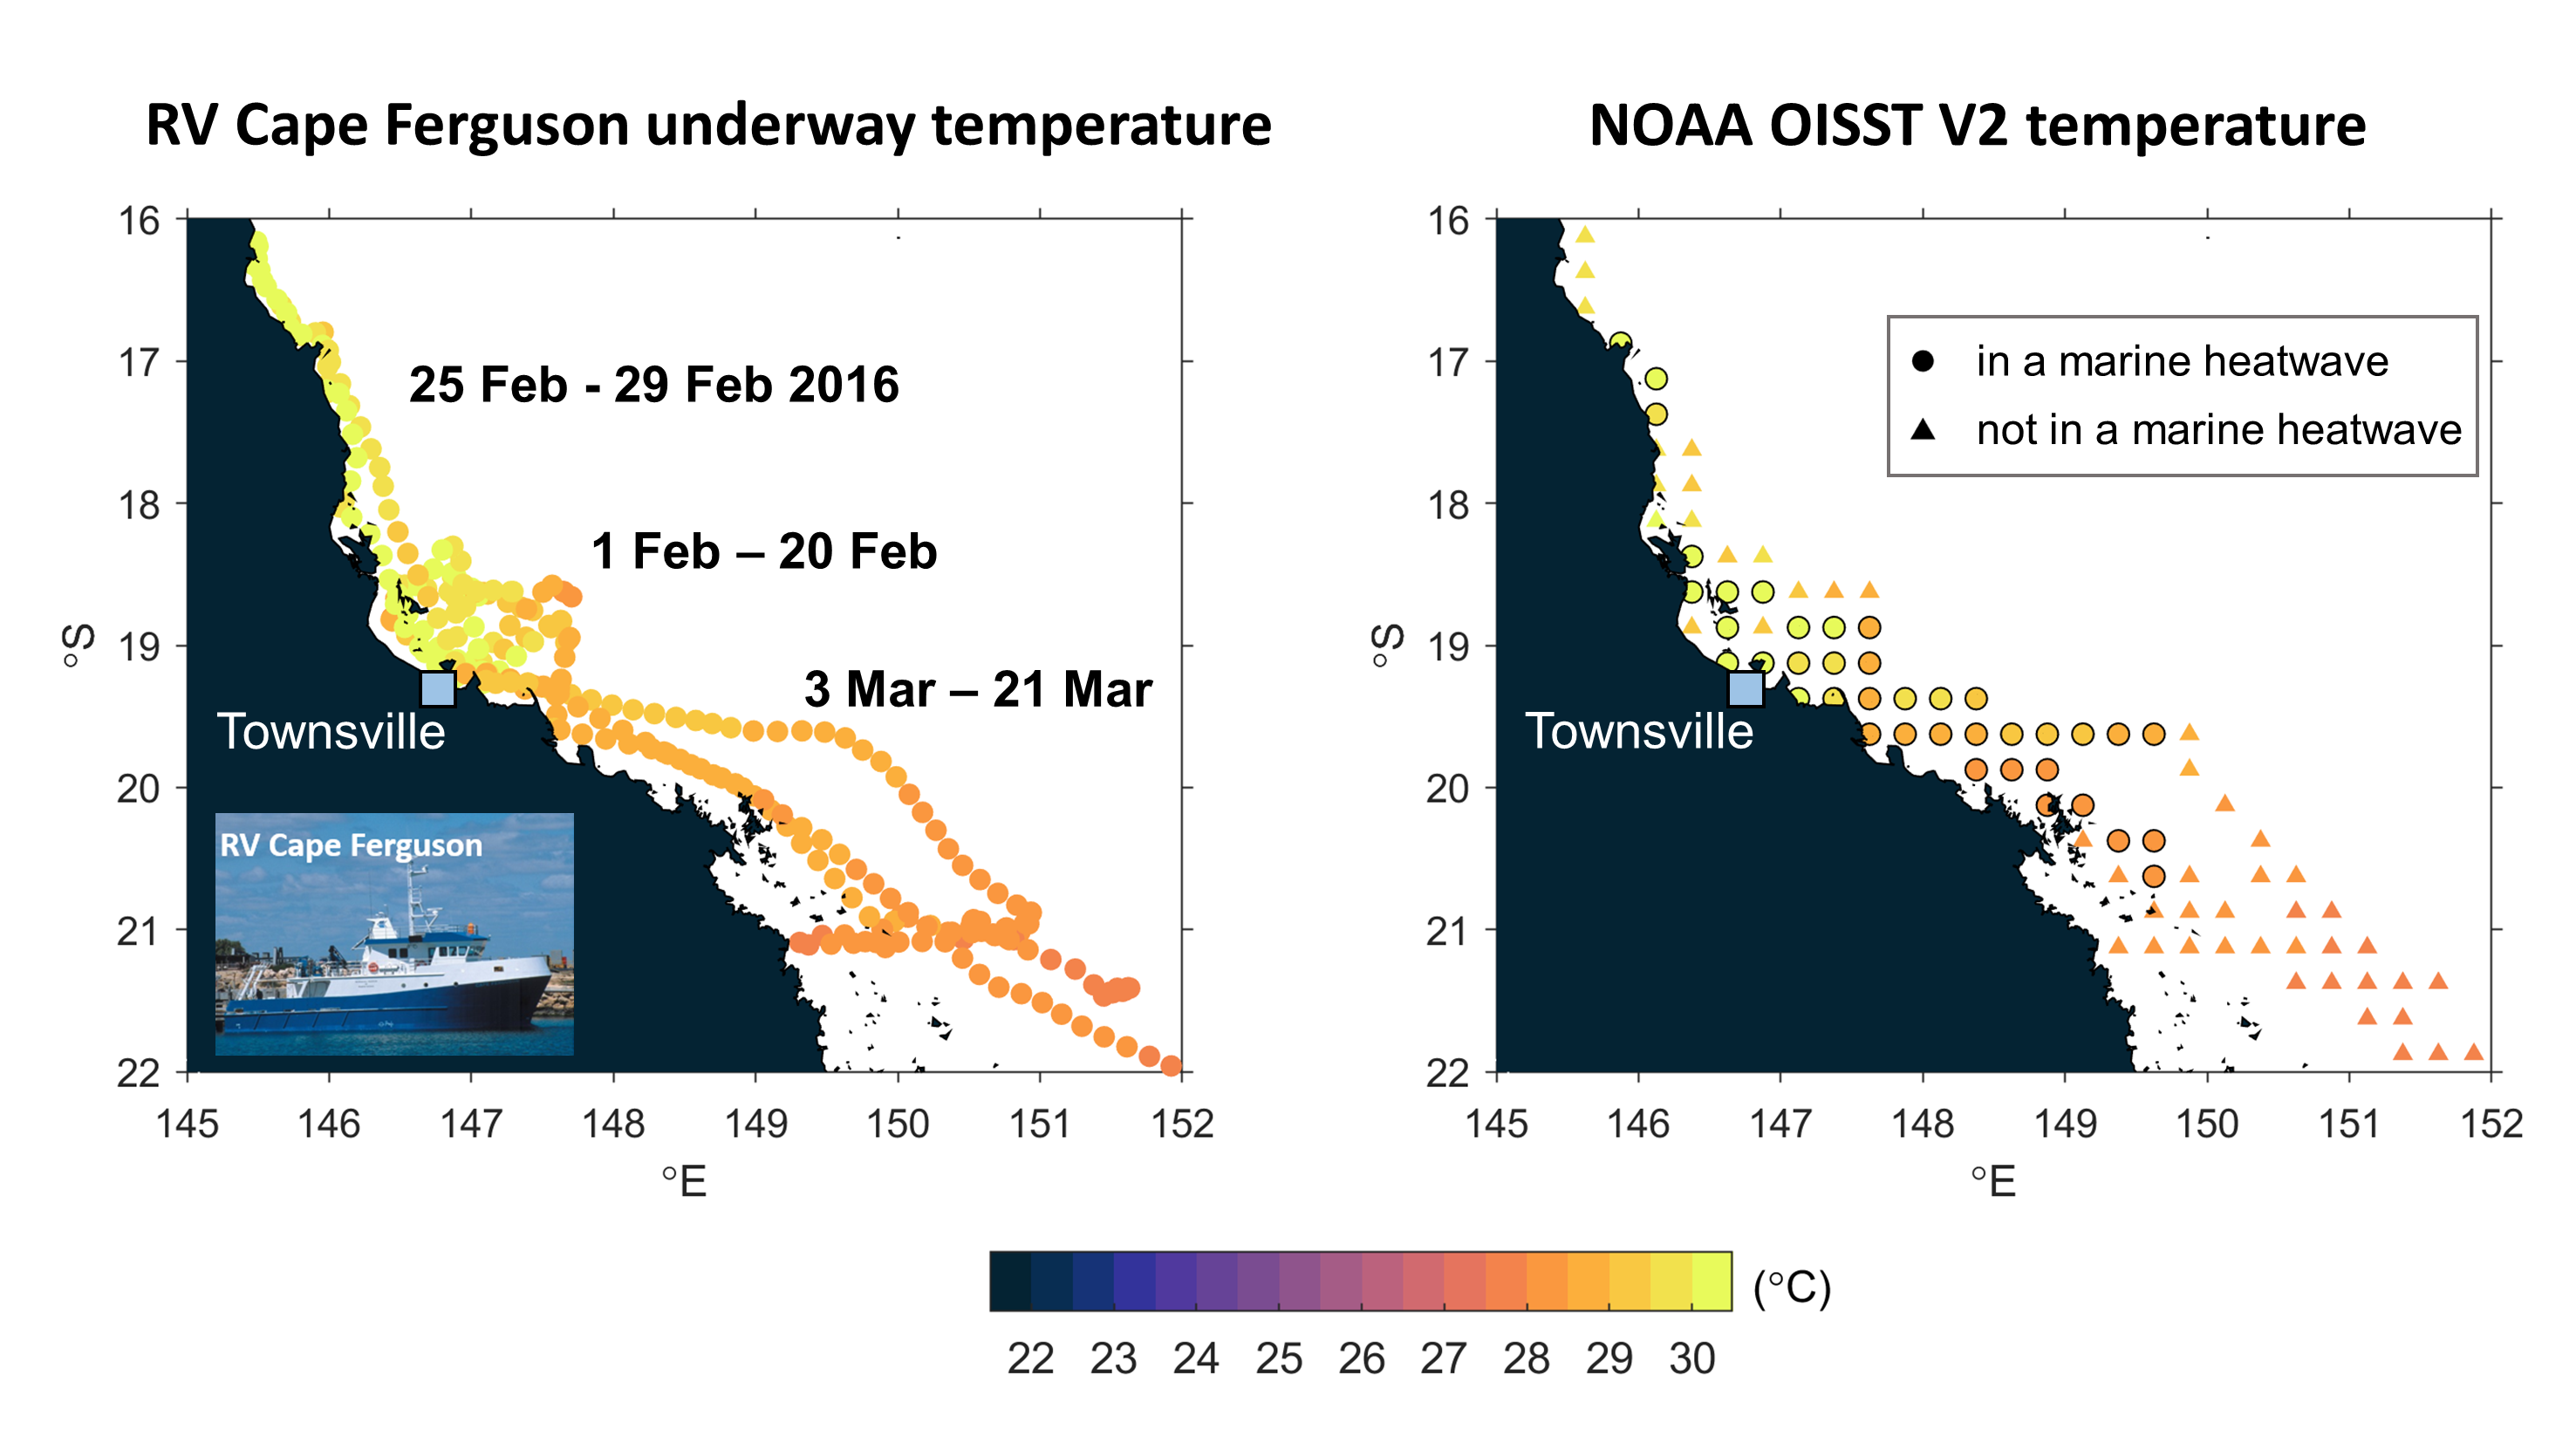
Example of using temperature data from the AIMS R/V Cape Ferguson to detect marine heatwaves in comparison with NOAA OISST V2.0 daily temperature data.
Image
Licence
Download original image
 Dr Jessica Benthuysen (Australian Institute of Marine Science), Data Source: SSTAARS and IMOS OceanCurrent
Dr Jessica Benthuysen (Australian Institute of Marine Science), Data Source: SSTAARS and IMOS OceanCurrent
Description
The ship temperature data has been compared with other remotely sensed sea surface temperature products to characterise temperature anomalies and extremes. On IMOS OceanCurrent , remotely sensed SST and ship temperature data are plotted against monthly climatology SST and SST percentiles from the Sea Surface Temperature Atlas of Australian Regional Seas (SSTAARS , Wijffels et al. 2018).
Data Source: IMOS Ocean Current http://oceancurrent.imos.org.au/ and SSTAARS dataset: https://portal.aodn.org.au/search?uuid=79c8eea2-4e86-4553-8237-4728e27abe10 metadata at: https://catalogue-imos.aodn.org.au/geonetwork/srv/eng/metadata.show?uuid=79c8eea2-4e86-4553-8237-4728e27abe10