Media for project "NESP TWQ Round 4 - Project 4.2 - Oceanographic drivers of bleaching in the GBR: from observations to prediction"
This page contains all media associated with this project. For more information about the project and its datasets please go to the project metadata record https://eatlas.org.au/data/uuid/d2a5db25-ca58-48a1-aee8-8e847dc3e291.
Images

Articles
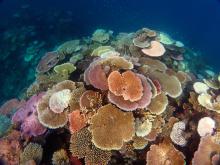
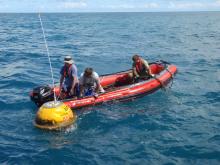
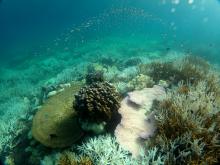
Over the last fifteen years a number of major efforts have significantly expanded the sustained monitoring of the Great Barrier Reef (GBR).
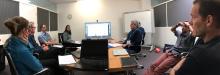
<p>How to access and use Coral Reef data for your research - Friday May 10, Moreton Island Note: This workshop is now finished, however, the training manuals and resources are available for download below. This workshop aimed to assist the scientific community to discover, access, download, use and understand the potential of the data being collected by a number of agencies on and around Coral Reefs. This includes IMOS and AIMS long term monitoring environmental and ecological data sets.