Spatial distribution of the cumulative threat of oil spill
Image
Licence
©
All rights reserved
Description
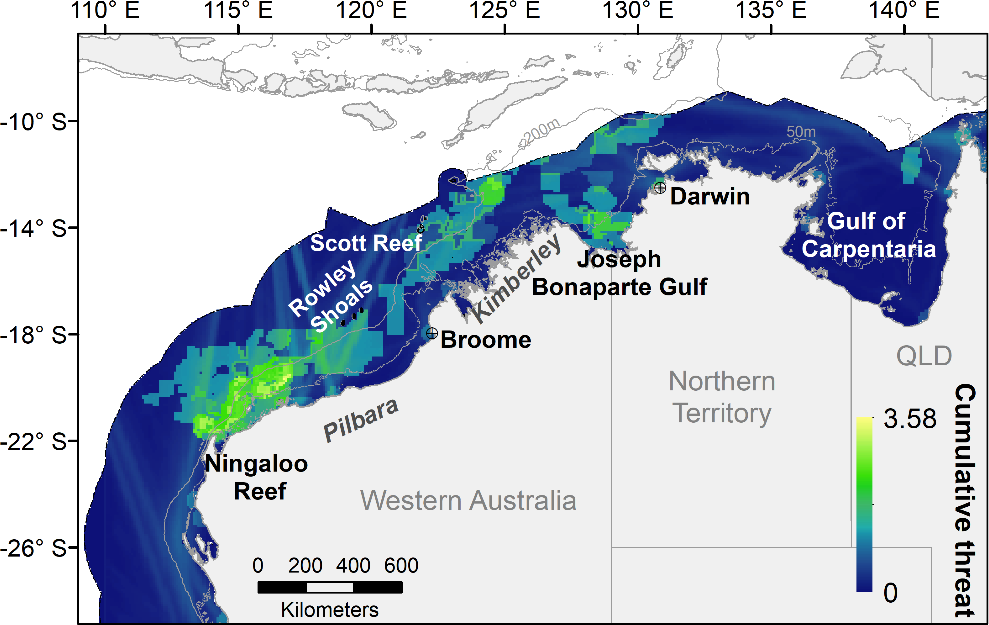
Spatial distribution across north-western and northern Australia, within Australia’s Exclusive Economic Zone (dashed grey line) of the cumulative threat of oil spill ranging from high (yellow and green) to low (blue).